Previously I’ve provided capacity factors for Danish, German and UK offshore windfarms. Now here are the numbers for the larger of the Belgian offshore windfarms. The ones shown here are the only ones I’ve been able to get detailed data for, so far.
Belgian offshore wind
| All numbers are to the end of December 2020. Analysis by EnergyNumbers.info. | Latest rolling 12-month capacity factor | Lifetime capacity factor | Age (y) | Installed capacity (MW) | Total elec. gen. (GWh) | Power per unit area spanned (W/m2) | Rolling 12-month capacity factors |
|---|---|---|---|---|---|---|---|
| Belwind | 39.6% | 37.9% | 10.1 | 165 | 3 206 | 4.7 | 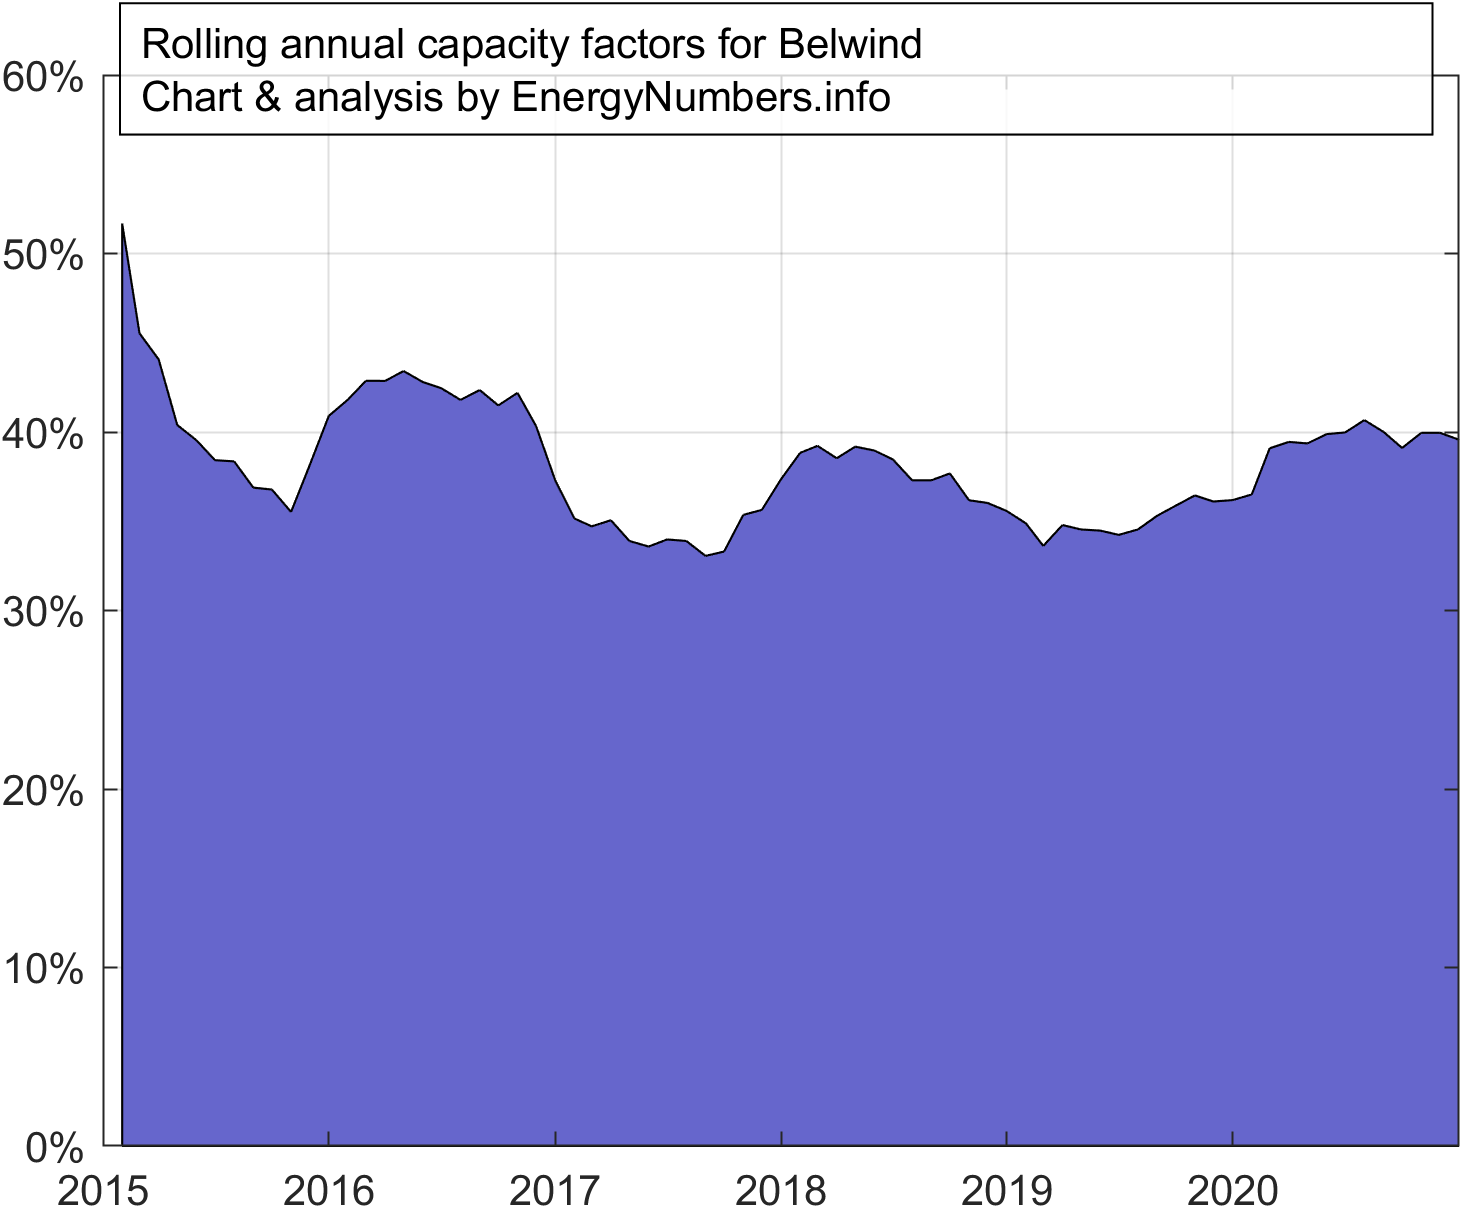 |
| Nobelwind | 46.7% | 44.1% | 3.6 | 165 | 2 279 | 3.3 | 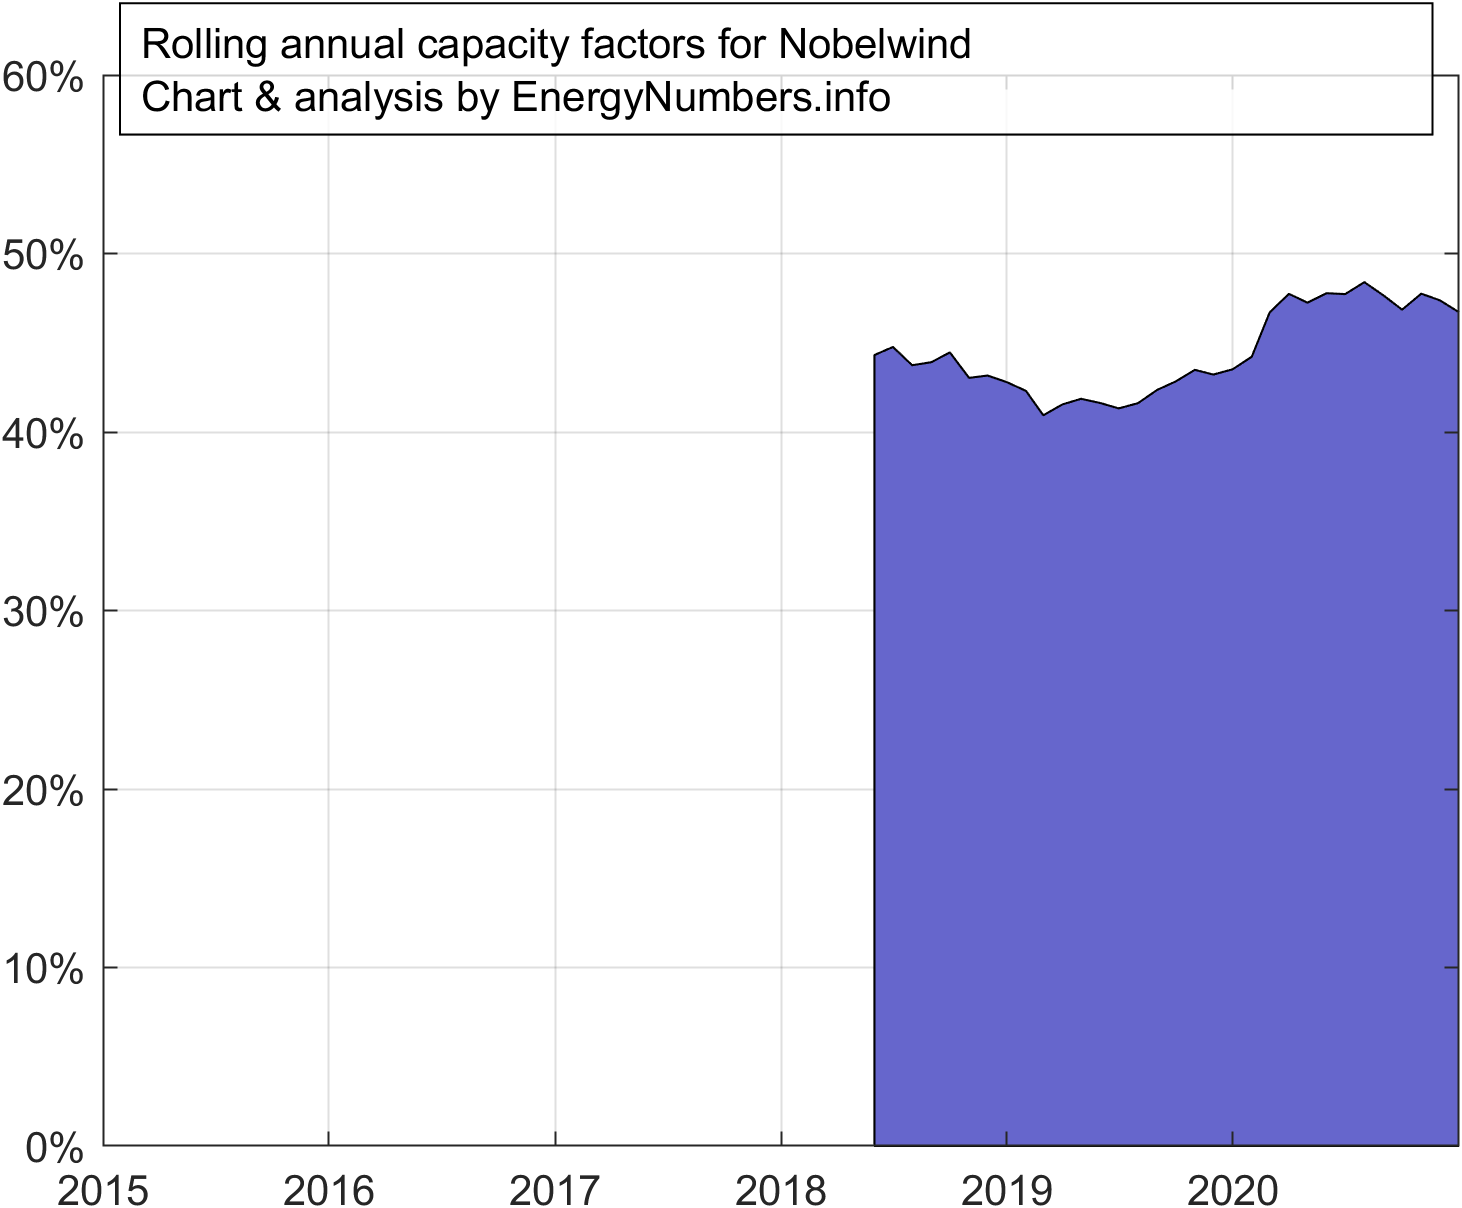 |
| Norther | 45.4% | 42.7% | 1.6 | 370 | 2 198 | 4.1 | 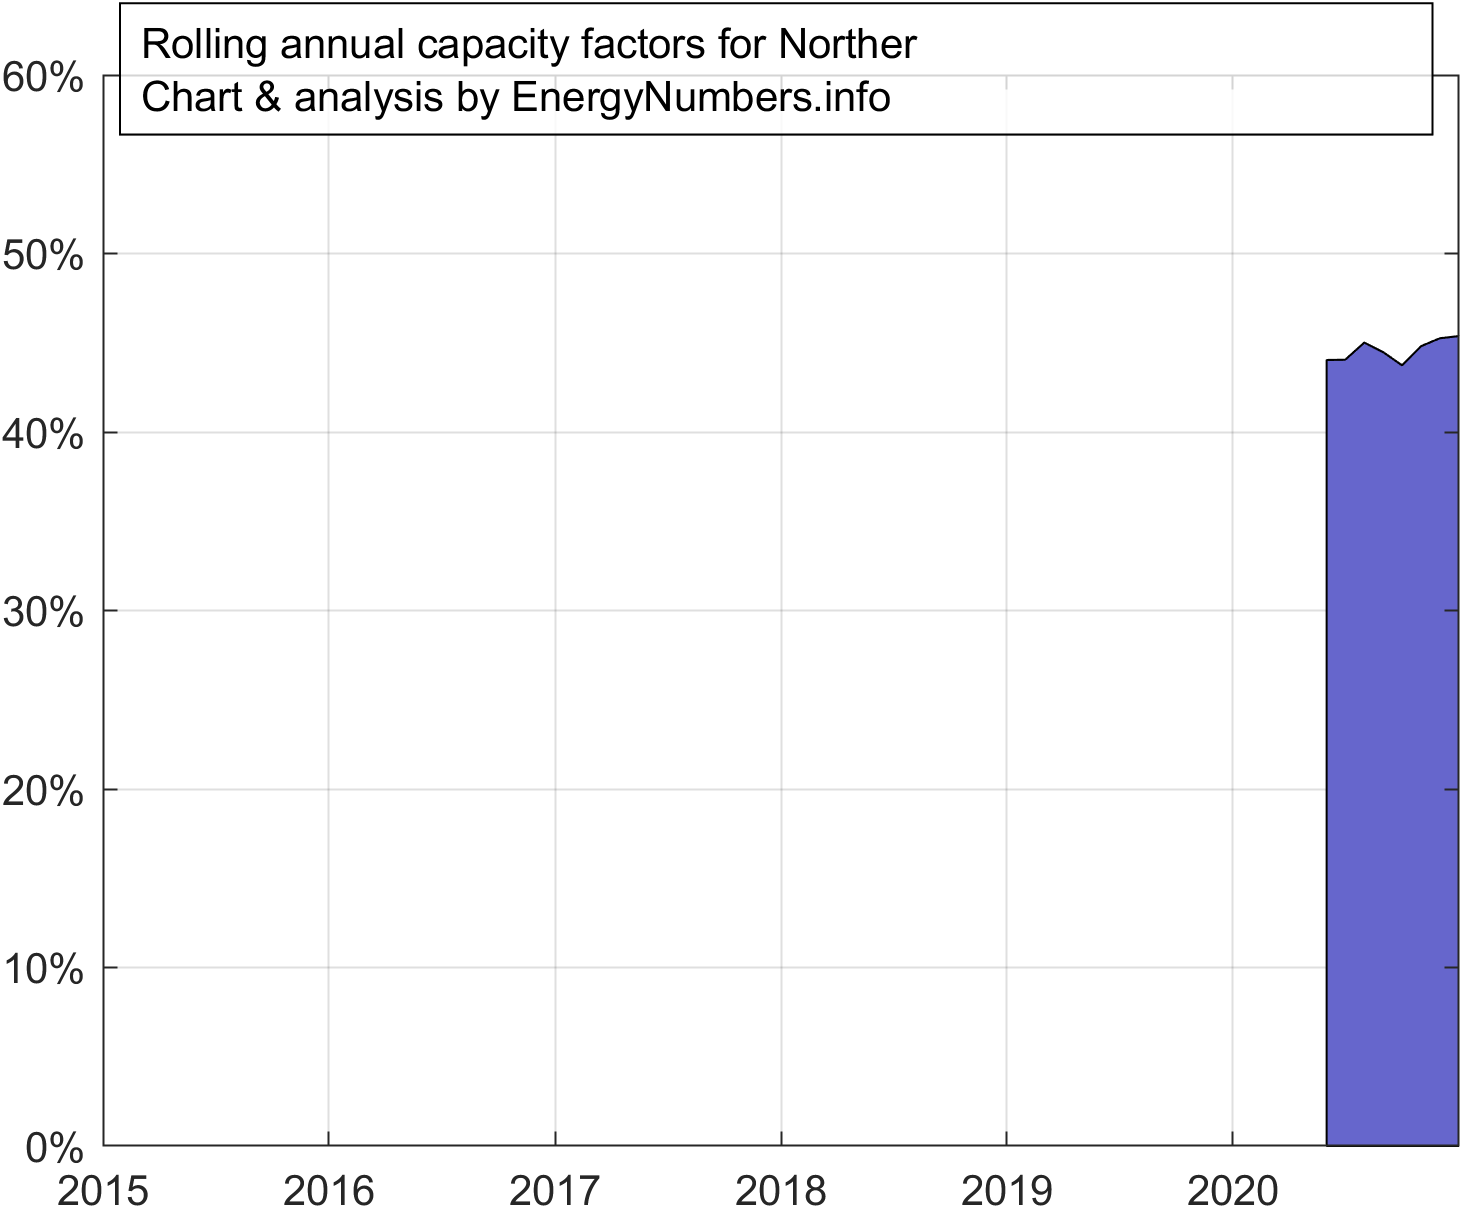 |
| Northwester 2 | 36.6% | 0.6 | 219 | 447 | |||
| Northwind | 43.9% | 41.6% | 6.5 | 216 | 4 601 | 6.5 | 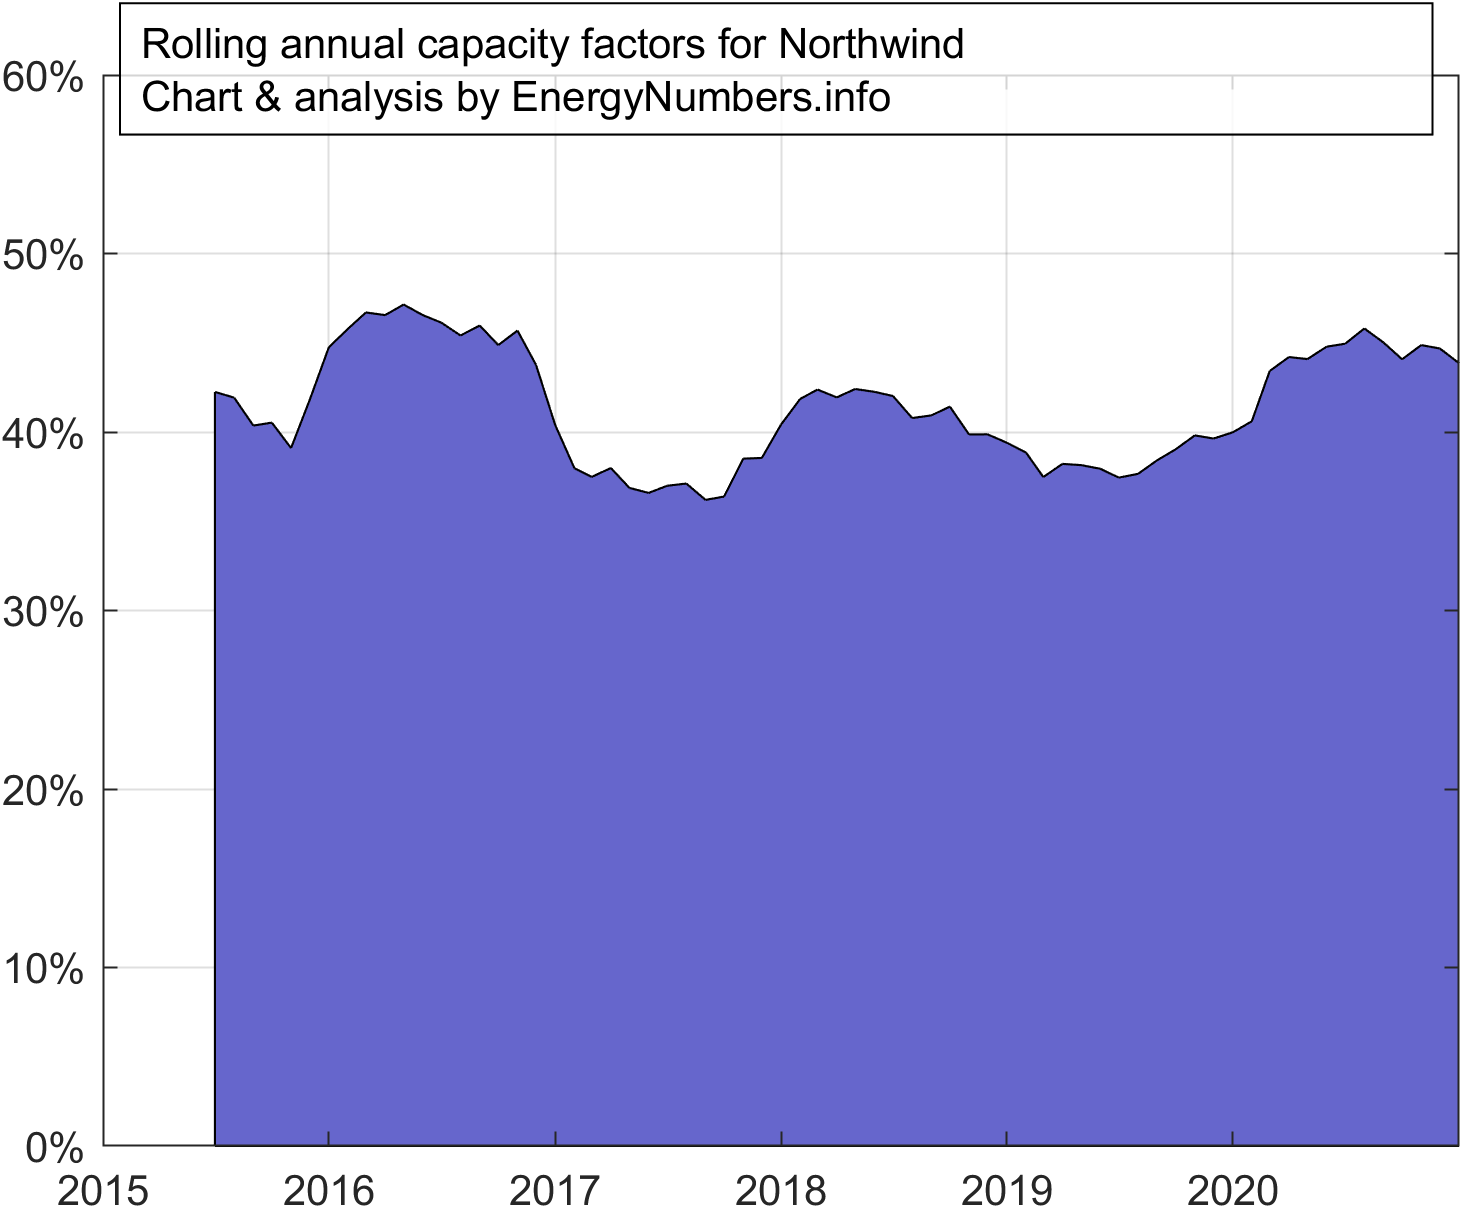 |
| Rentel | 41.3% | 39.0% | 2.0 | 309 | 2 117 | 5.2 | 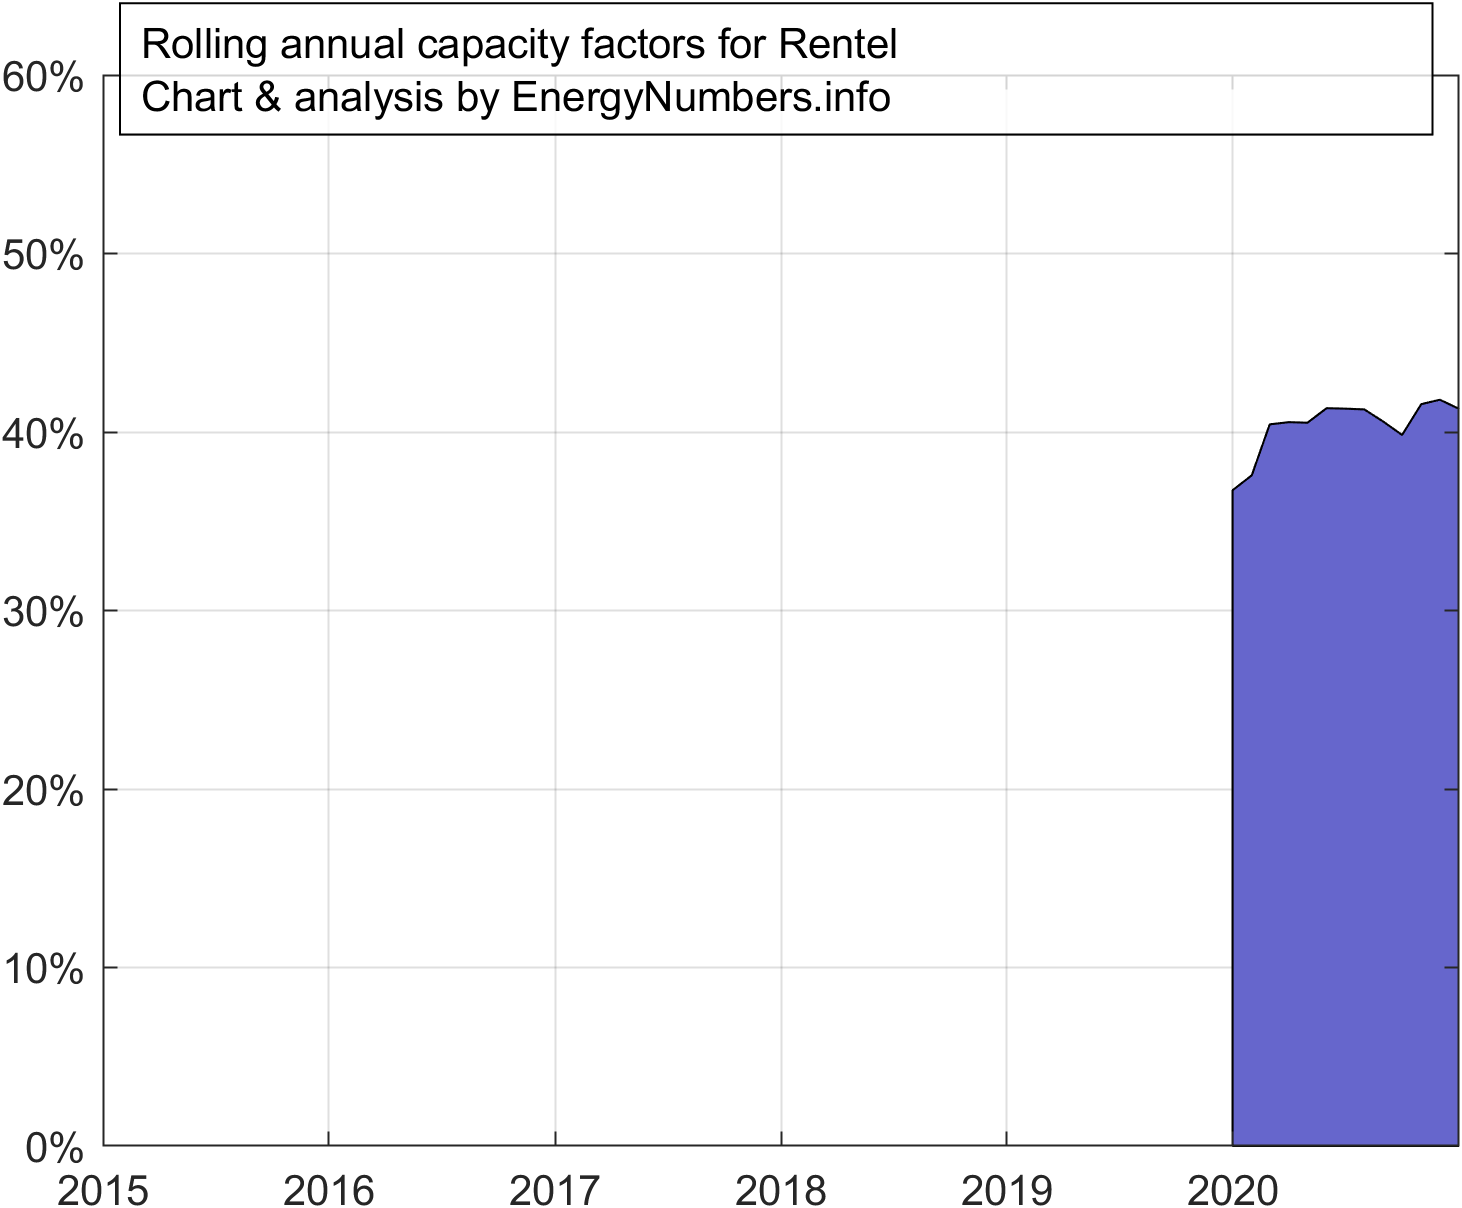 |
| Thorntonbank NE | 32.9% | 32.4% | 7.9 | 159 | 2 637 | 4.7 | 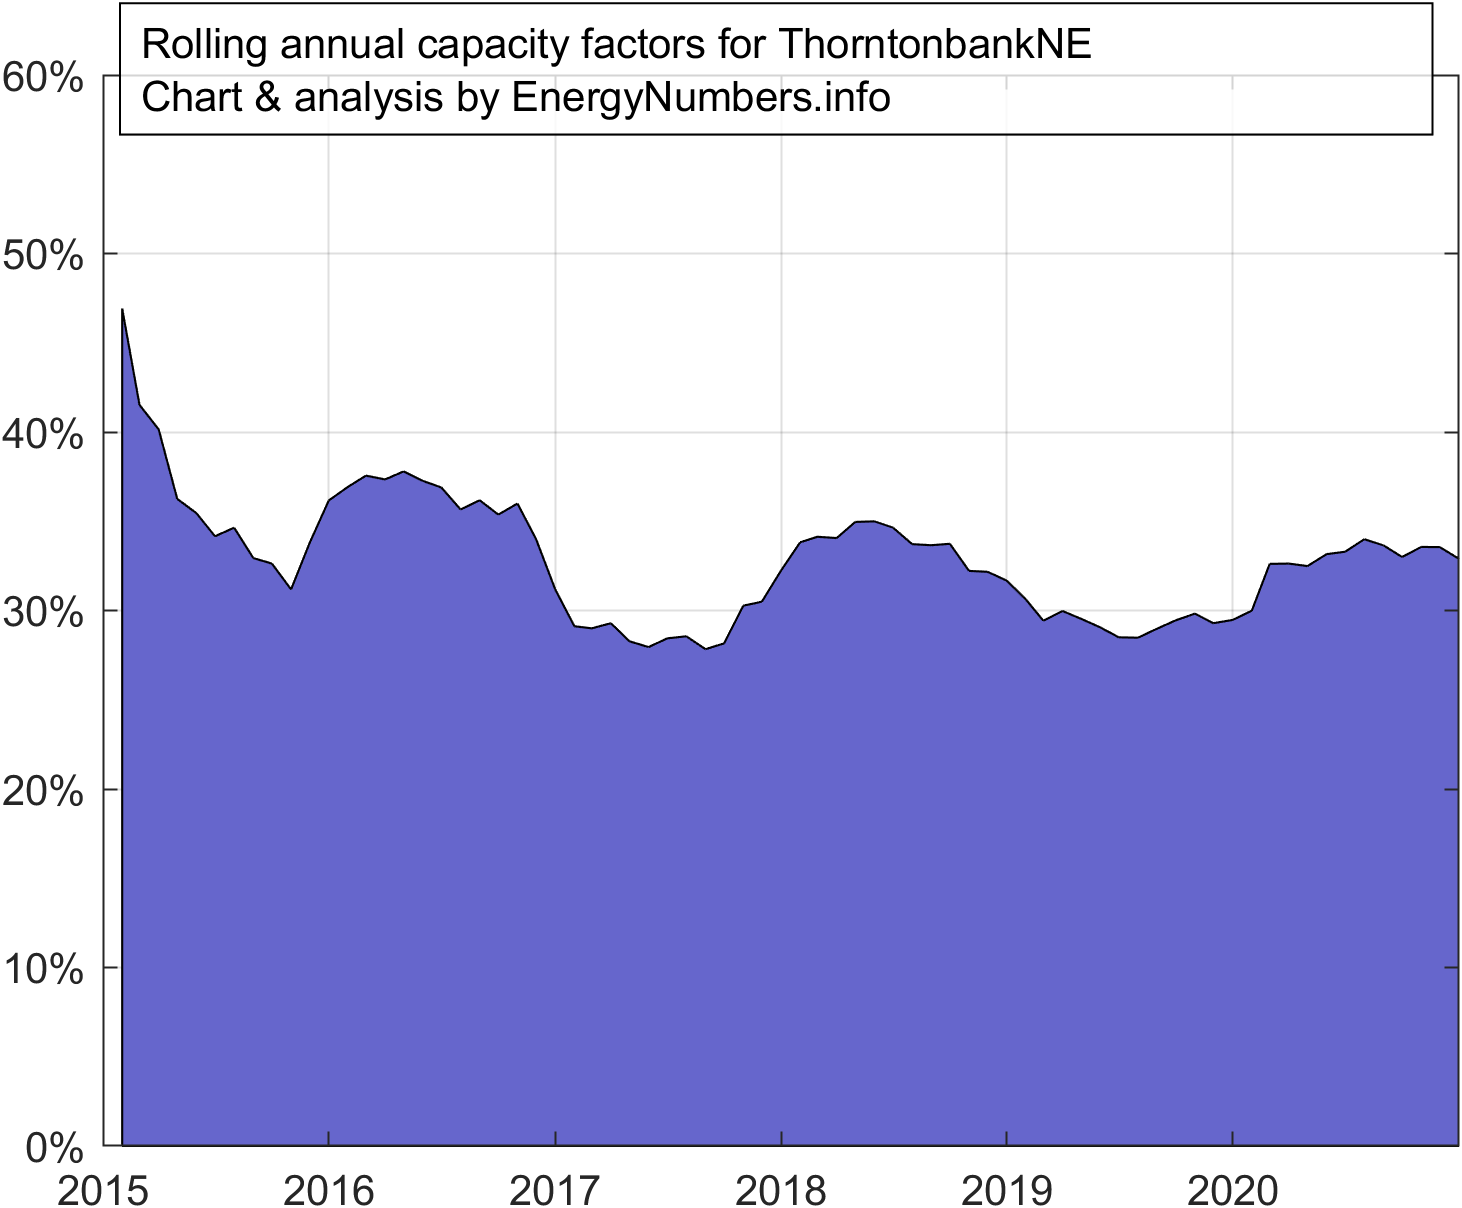 |
| Thorntonbank SW | 39.5% | 36.8% | 7.3 | 175 | 3 298 | 5.0 | 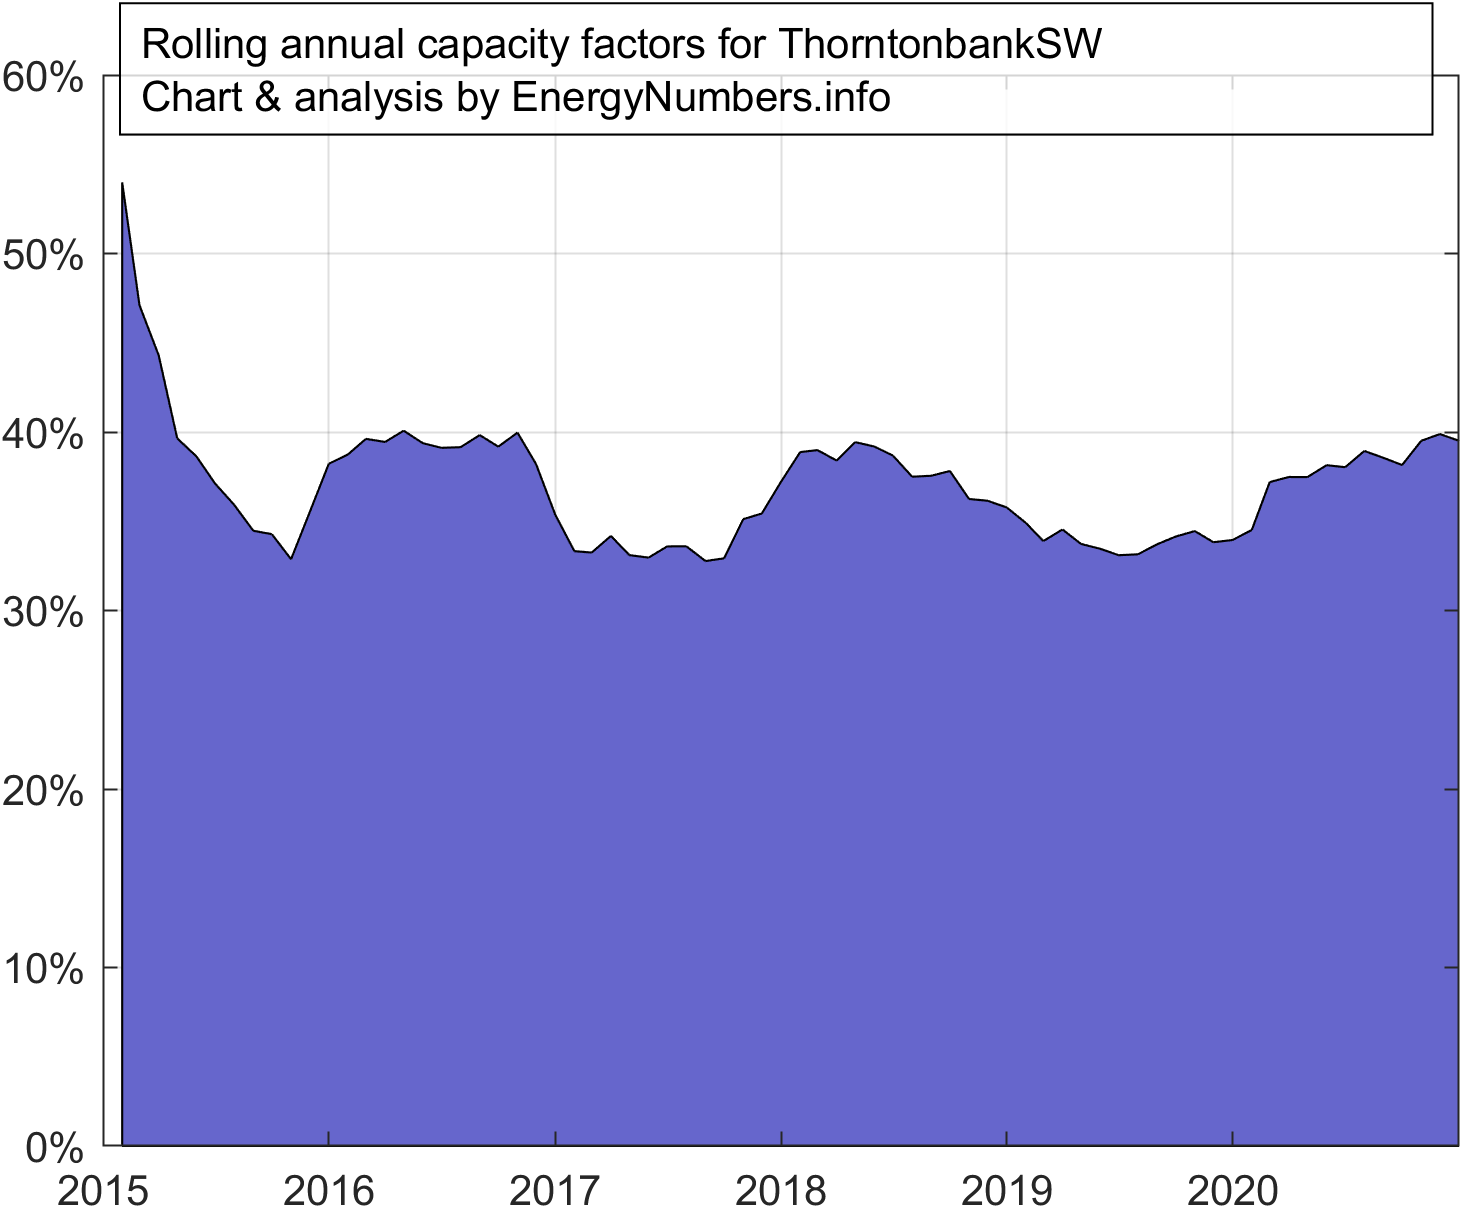 |
| Total | 42.0% | 31.4% | 1778 | 20 782 | 4.6 |
Load duration curves
I’ve constructed for each of the offshore windfarms for which there is sufficient detailed hourly data (this will usually mean at least a year’s worth). Use the pause and play buttons to stop and start the sequential display of curves. Click on the windfarm name in the legend to toggle the display of that farm’s curve.
Methodology
Note that for each individual windfarm, its curve is based on data starting from the date that the windfarm was fully commissioned, or from 1 Jan 2015, whichever is later: data is only available from 2015 onwards. The windfarm’s age is calculated from the date it was fully commissioned.
The Thornton Bank windfarm was built out in three phases, I-II-III. However, the hourly data is broken down into two groups, SW and NE. As you can see from this map, courtesy of 4COffshore, most of phase II is in the NE section. The SW section contains the rest of phase II, as well as all of phases I and III.
My thanks to Rémi_C2W on Twitter for solving the mystery of the Northwind time-series in the ENTSOE data: he worked out that the reported data is the sum of output from both Northwind and Nobelwind: so the real Northwind output could be calculated by subtracting the reported Nobelwind output from it. ENTSOE have now fixed this, so this transformation is no longer needed.

