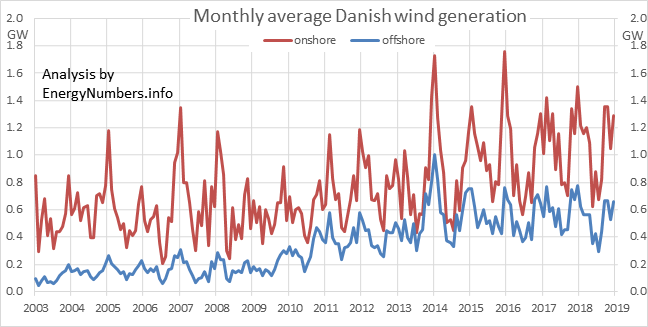
 Here are the average capacity factors of every Danish offshore wind farm, newly updated to include data to the end of 2018. Compare these with the capacity factors for German, and UK, and Belgian offshore wind farms.
Danish windfarms also include the most productive wind turbines in the world, at Rønland I: the turbines have been operating for over 16 years now, with a lifetime capacity factor of 44.3%; of its eight turbines, four are rated at 2.3MW peak power, and each of those four had by the end of July 2014 generated over 100 GWh: the first turbines to pass that milestone.
And, for the first time, I’ve had to update the calculations for a new phenomenon: the first decommissioning of a commercial offshore windfarm: Vindeby generated its last electricity in February 2017, after a remarkable 25 years of life.
Nissum Bredning is the newest offshore windfarm in Denmark – a demonstration site with four prototype turbines. Samsø has finally replaced the turbine that broke in December 2015. Construction is ongoing at Horns Rev 3, which became operational at the end of 2018.
| All numbers are to the end of December 2018. Analysis by EnergyNumbers.info. Raw data from ens.dk | Latest rolling 12-month capacity factor | Life capacity factor | Age (y) | Installed capacity (MWp) | Total elec. gen. (GWh) | Power per unit area spanned (W/m2) | Rolling annual capacity factors (click to enlarge) | Quantiles |
|---|---|---|---|---|---|---|---|---|
| Anholt 1 | 47.8% | 49.0% | 5.7 | 399.6 | 9 864 | 2.2 |  | |
| Avedøre Holme | 35.4% | 38.1% | 8.5 | 10.8 | 306 |  | ||
| Frederikshavn | 26.1% | 30.3% | 15.6 | 7.6 | 315 |  | ||
| Horns Rev I | 30.0% | 41.2% | 16.2 | 160 | 9 347 | 3.3 |  | |
| Horns Rev II | 47.6% | 48.0% | 9.3 | 209.3 | 8 213 | 3.0 |  | |
| Middelgrunden | 19.6% | 25.2% | 18.0 | 40 | 1 592 |  | ||
| Nissum Bredning | 39.5% | 39.5% | 1.0 | 28 | 97 | ") | ||
| Nysted (Rødsand) I | 34.9% | 37.1% | 15.5 | 165.6 | 8 370 | 2.6 |  I") | |
| Nysted (Rødsand) II | 40.6% | 43.5% | 8.5 | 207 | 6 747 | 2.6 |  II") | |
| Rønland I | 40.9% | 44.3% | 16.0 | 17.2 | 1 066 |  | ||
| Samsø | 37.8% | 39.1% | 14.5 | 23 | 1 253 |  | ||
| Sprogø | 29.4% | 33.5% | 9.2 | 21 | 566 |  | ||
| Tunø Knob | 27.8% | 30.2% | 23.6 | 5 | 313 |  | ||
| Vindeby (closed) | 22.0% | 25.5 | 4.95 | 244 |  | |||
| Total | 40.8% | 41.7% | 1271 | 48 294 | 2.6 |  |
Load duration curves
Here’s for each of the offshore windfarms for which there is detailed hourly data from ENTSOE (from the start of 2015 to the end of 2018). Use the pause and play buttons to stop and start the sequential display of curves. Click on the windfarm name in the legend to toggle the display of that farm’s curve.
Calculation method
Just as with the UK offshore windfarm capacity factors, these capacity factors are calculated by calculating, for each turbine in a given wind farm, the number of hours since it was first connected to the grid. This is then multiplied by its capacity, to give the number of peak-MW-hours. These figures are summed across all turbines in a wind farm, and divided into the total energy generated by that wind farm, to give its capacity factor.
Power yield per unit surface area spanned is only calculated for the larger windfarms: when a windfarm is just a single row of turbines, it doesn’t have a well-defined surface area spanned. These yield figures represent 90% of the installed capacity.
Sources
ENS register of Danish wind turbines: thanks to ENS and to Energinet.DK for making the turbine-specific data behind this table available. This post gets updated as new data becomes available.