Previously I’ve provided the figures for Danish offshore windfarms, for the UK , and for Belgium too. Here are the numbers for the larger German offshore windfarms. The ones shown here are the only ones I’ve been able to get detailed data for, so far, so updates here will be restricted. If you know of additional data sources, in particular for BARD Offshore 1, for which I no longer have a live supply, please let me know on Twitter.
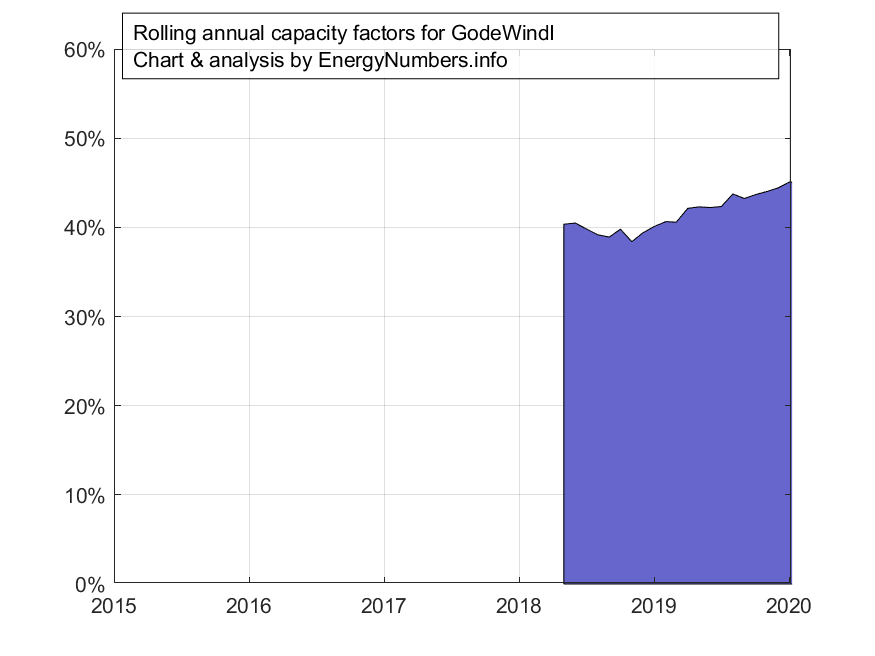
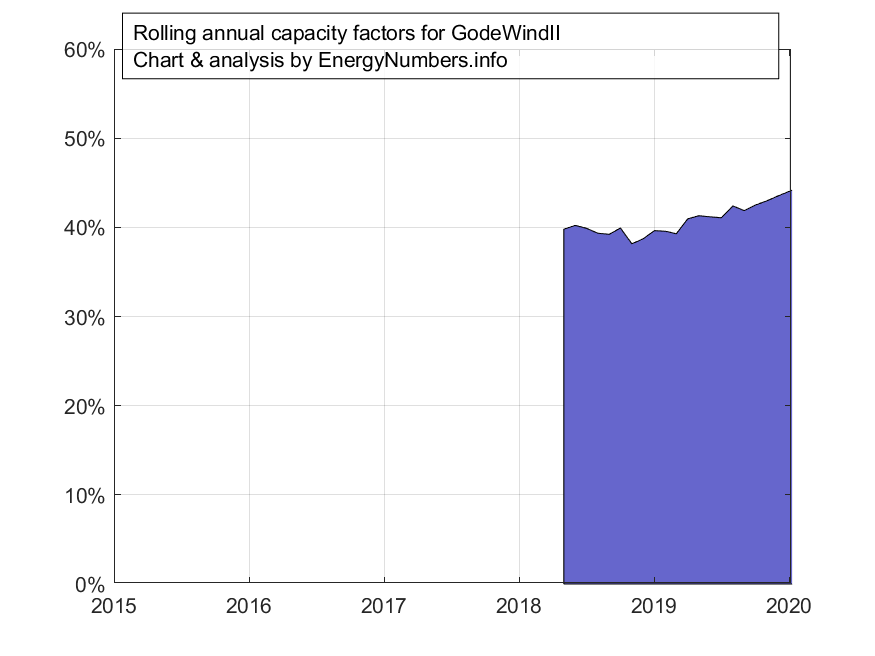
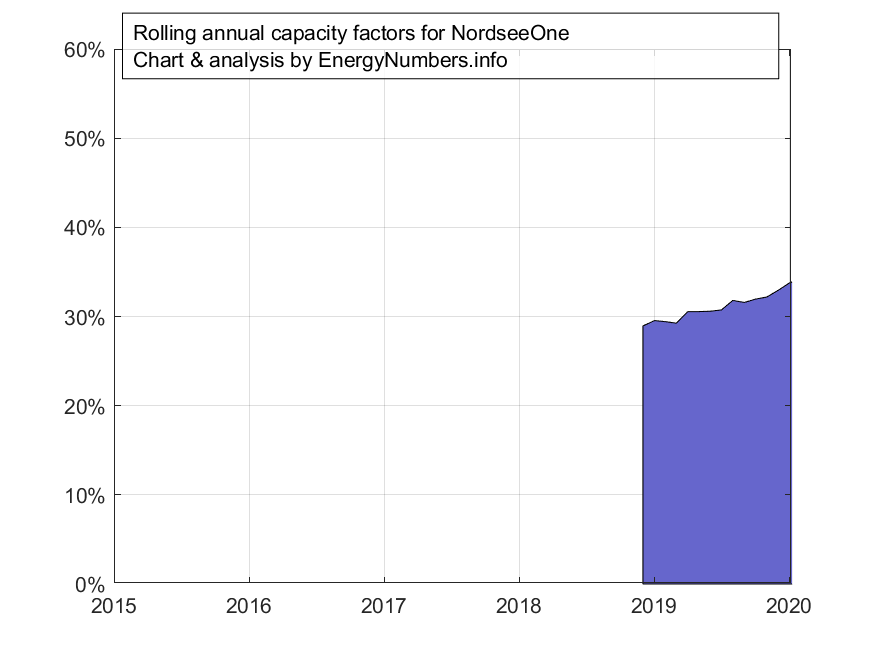
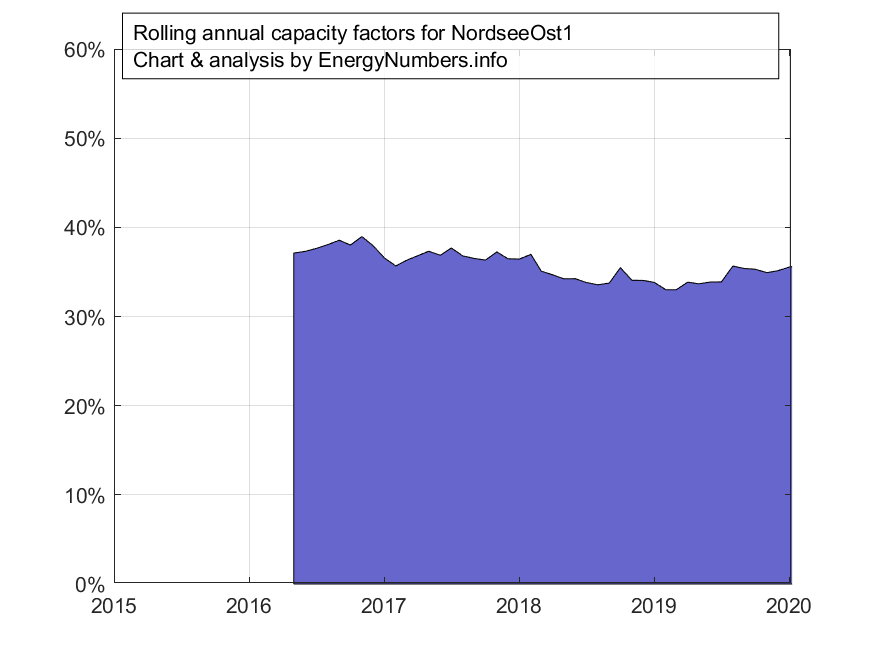
German offshore wind capacity factors
Load duration curves
I’ve constructed for each of the offshore windfarms for which there is detailed hourly data. Use the pause and play buttons to stop and start the sequential display of curves. Click on the windfarm name in the legend to toggle the display of that farm’s curve.
Methodology
Note that for each individual windfarm, its curve is based on data starting from the date that the windfarm was fully commissioned, and the windfarm’s age is calculated as starting at that date. There is one exception: the Bard Offshore Windfarm was fully commissioned in August 2013, but detailed data on its generation is only available from spring 2017 onwards – so the “age” shown for this windfarm is the age of the oldest available data, not the age of the windfarm itself.
The numbers for DanTysk did look strange: I had to clean a stretch of five months of data that was clearly wrong. Hence, there’s a gap in the data for it. A small kink remains in its load duration curve; this may be an artefact of a small amount of remaining problematic data. There are smaller gaps in data for several of the windfarms, and I’m not yet sure how that missing data is distorting these curves.
Windfarms less than a year old are excluded from the calculations of the power density per unit area spanned. The figure for total power density is a weighted average of the windfarms that are a year older or more: this is weighted by size, but not by time. So a windfarm that’s twice as large contributes twice as much to the total; whereas a windfarm that’s twice as old, does not.
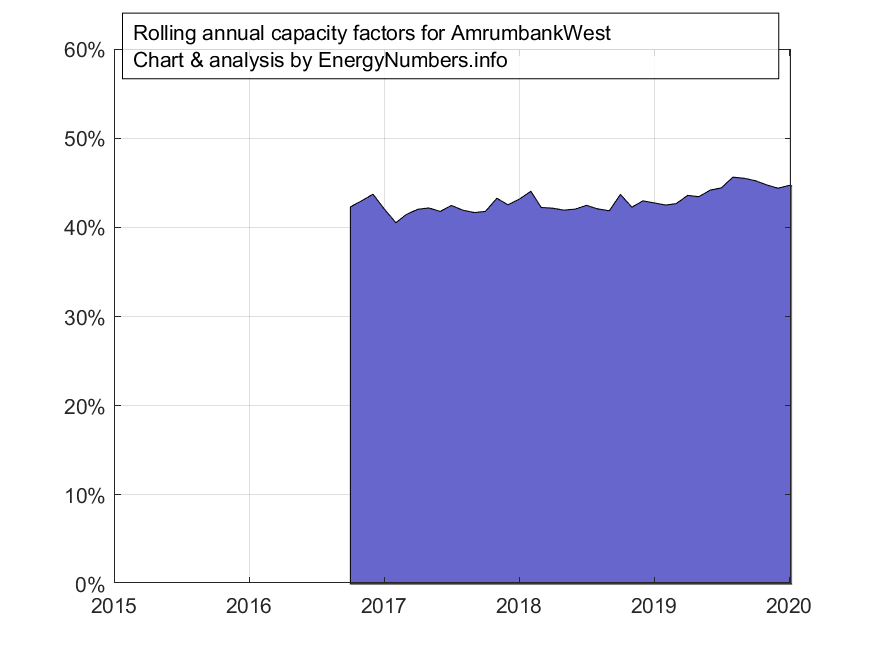

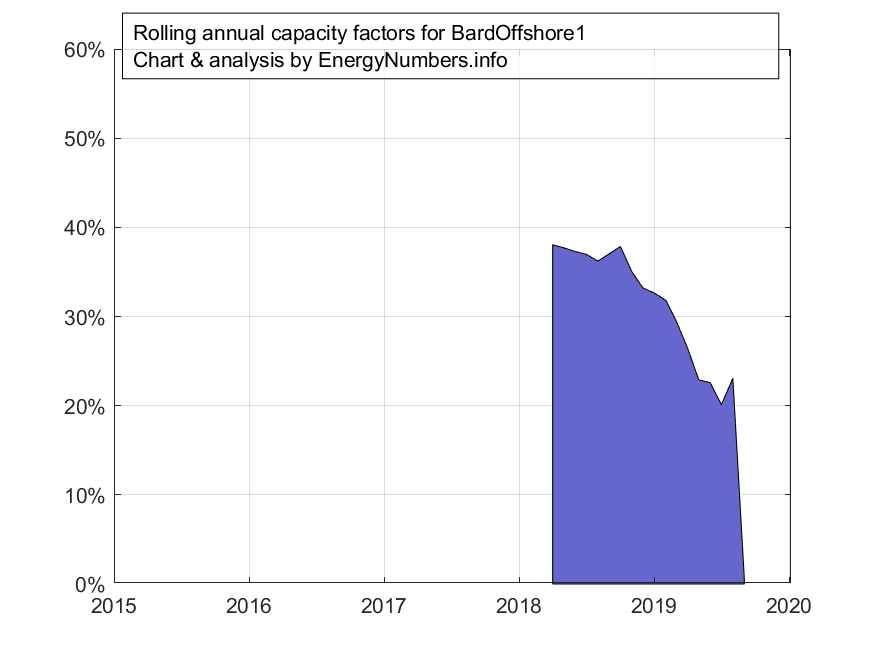
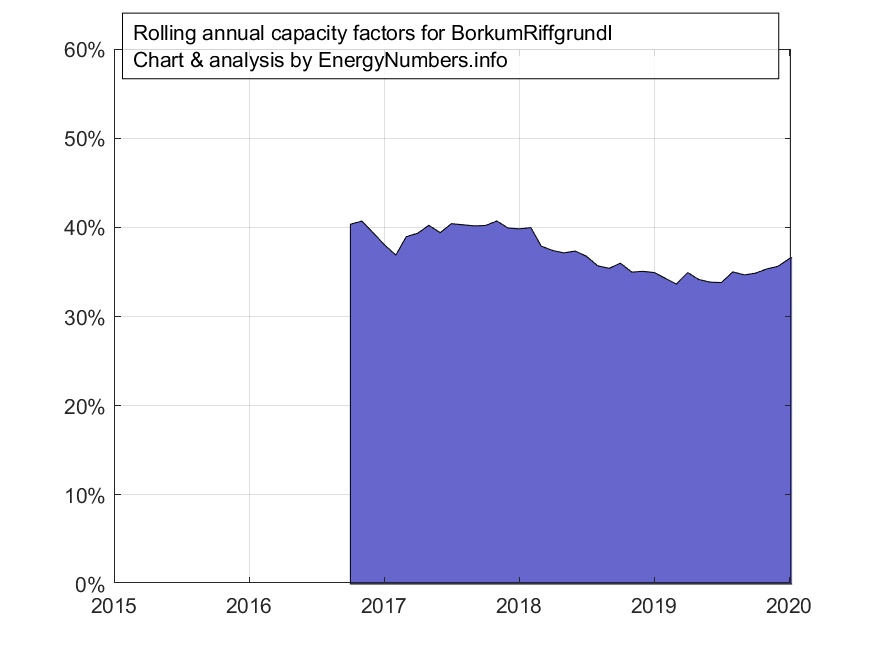
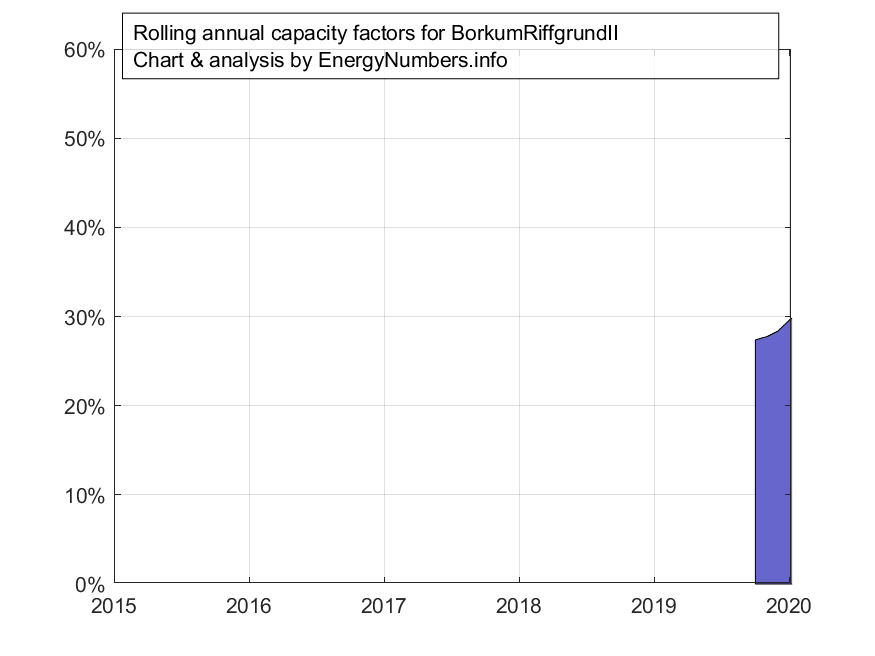

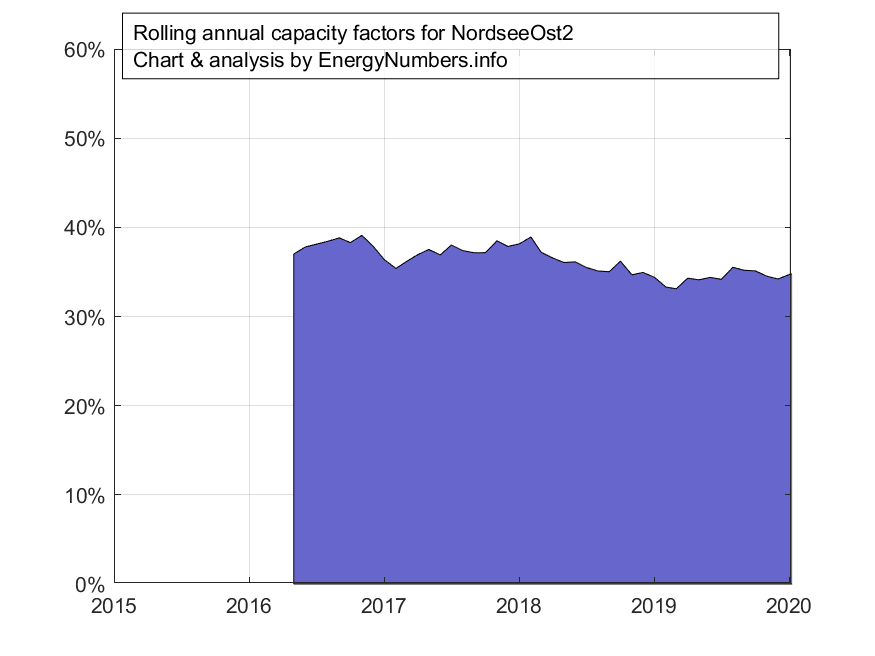
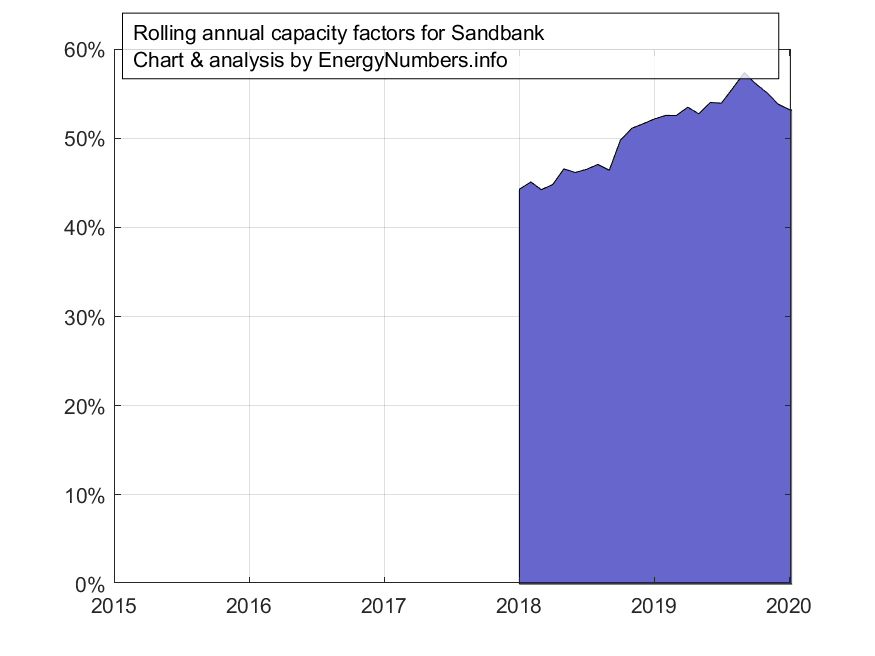
 Here are the average
