On 17 December 2015 Britain passed a new landmark on the road to cleaner electricity: for four hours, from 03.00 to 07.00, the grid had a plurality of wind: wind was the largest generation type on the grid: there was more wind generation than generation in Britain from gas, or from coal, or from nuclear, or any other domestic source. That was the case for the four hours as a whole, and for each half-hour within that four-hour period.
Category: onshore wind
100% renewables: there’s more than enough space
Posted by – 2015/12/15
Is land area a barrier, or a significant constraint, to achieving 100% renewables?
Another booming year for Chinese renewables
Posted by – 2015/01/17
From China’s 2014 energy statistics:
- New renewable capacity outstripped new coal capacity;
- additional output from renewables (the increase in output in 2014 over 2013) was greater than the total output from nuclear;
- total generation from hydro, wind and solar all went up;
- total generation from fossil thermal plant went down;
- coal & gas consumption for electricity went down.
And so to the detail.
Half of the 104 GW of new capacity is renewables; 47 GW is thermal plant (predominantly coal and fossil gas) and 5 GW is nuclear. 22GW of the renewable capacity is hydro, 20 GW wind, and 11 GW solar.
I’ve updated this post on 2015-03-12 with the more specific statistics now available from China.
Generation from wind increased to 17.88GW (average electricity production) this year, from an estimated 16GW last year. Hydro generation increased by about 17% to 122 GW. China now has 27 GW of grid-connected solar capacity, and 20 GW of nuclear capacity.
Output from thermal (coal & gas) plants dropped in 2014, because although thermal plant capacity increased by 5.9%, this was outweighed by the relative decrease of 6.3% in its capacity factor (from 57.3% to 53.7%, an absolute change of -3.6%, which is a relative change of -6.3%). In addition, the efficiency of coal & gas plants went up, meaning that the consumption of coal & gas for electricity generation decreased in 2014.
Total electricity generation was about 632 GW, of which 476 GW was thermal, 122 GW was hydro, 17.8 GW was wind, 14.4 GW was nuclear, and 2.6 GW was solar.
So coal & gas generation decreased slightly; hydro generation increased by about 17 GW; solar generation increased by about 1 GW; and wind generation increased by about 2 GW; giving a net increase in renewables generation of about 20 GW.
Wind records in Britain
Posted by – 2015/01/01
It’s been a remarkable few months for wind generation in Britain, Feb 2014 – Jan 2015, and the last of those two months in particular. Several records were broken, and re-broken.
You can see the live British grid data, including wind generation, here; and here’s a version for mobiles (cellphones) and other small-screen devices.
February 2014 saw the highest monthly average metered wind power generation that Britain’s ever achieved: in that month, average generation from metered windfarms was 4.09 GW.
The half-hour starting at 06.00 on the morning of 18 October 2014 saw the highest percentage contribution of wind (penetration) to total demand: 23.5% from metered windfarms; 32.9% from all windfarms.
The half-hour starting at 19.30 on 9 December 2014 saw the highest half-hourly wind generation: 6.80 GW from metered windfarms; 9.42 GW from all windfarms.
And until January 2015, December 2014 also had the highest amount of wind-generated electricity of any month: 3.90 TWh (of which a record 2.85 TWh was from metered windfarms); and the highest monthly contribution from wind to total demand – 13.9% from all windfarms (the highest contribution from metered windfarms was 10.5%, in February 2014). But January 2015 outdid the preceeding month, with 14.4% of demand being met by metered and embedded wind; 4.13 TWh of wind in total, which was equivalent to an average power of 5.56 GW; and 2.95 TWh from the metered windfarms.
Records for electricity generation from wind in Britain
| analysis by EnergyNumbers.info | All windfarms | Metered windfarms only | |||
|---|---|---|---|---|---|
| Monthly | Max wind penetration | 14.4 % | Jan 2015 | 10.5 % | Feb 2014 |
| Maximum energy | 4.13 TWh | Jan 2015 | 2.95 TWh | Jan 2015 | |
| Max average power | 5.56 GW | Jan 2015 | 4.09 GW | Feb 2014 | |
| Half-hourly | Max wind penetration | 32.9 % | 2014-10-18 06.00-06.30 | 23.5 % | 2014-10-18 06.00-06.30 |
| Max average power | 9.42 GW | 2014-12-09 19.30-20.00 | 6.80 GW | 2014-12-09 19.30-20.00 | |
(thanks to BMReports and Elexon for the raw data I used for this analysis)
Decarbonising the Irish grid
Posted by – 2014/01/01
Following on from this question on the Sustainability Stack Exchange about decarbonisation in Eire, and a discussion on the Claverton Energy Group about the British and Irish grids, I took a quick look at the data on carbon intensity and wind generation in the Irish grid. This uses all the available data at time of writing – 38 months, from November 2008 to the end of December 2013.
Here’s the impact that its wind generation has on the carbon intensity of the grid: each MW of wind power that’s generating, reduces the carbon intensity of electricity by 0.138 gCO2/kWh: 1GW of generation reduces the carbon intensity by 138 gCO2/kWh. For context, average demand is about 2.9 GW, and peak demand is about 5 GW.
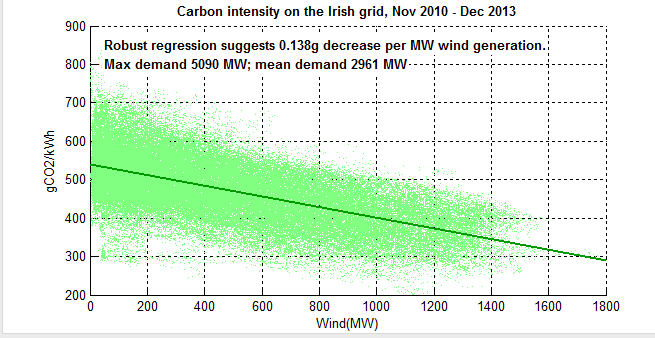
I’ve used Robust regression, as there are some reporting errors in there (further cleaning has refined the estimate to 0.136 from 0.138).
The y-axis is baselined at 200 gCO2/kWh, because there’s very little real data below that line at present.
I note that Eirgrid has heat-curves for every thermal plant on the grid (which is how they calculate the carbon intensity). Does National Grid have anything like that for GB? Do you? Would you like to share them with me?
And re the data-cleaning – just in case anyone else downloads the wind forecast and generation data, note that every year on the last Sunday in October, the wind data for each of the four quarter-hours when the clocks go back is duplicated.