Here are the average capacity factors for offshore wind farms in UK waters, newly updated to include data to the end of August 2026 (though there are still some figures to come through for the most recent couple of months, but only for the smaller windfarms). There are 45 operational windfarms presented here, and three closed demonstration sites.
Hywind Scotland has returned to 50%+ rolling capacity factors. This floating windfarm, has behaved differently to any windfarm we’ve seen before, and that’s best portrayed in its load duration curve. The load-duration curves at the bottom of this page show the differences in distribution of outputs: click on the individual farm names in the legend, to toggle the display of individual curves.
You might be interested in comparing these with the capacity factors and load-duration curves for Belgium, Denmark and Germany.
| All numbers are to the end of August 2026. Analysis by EnergyNumbers.info. Raw data from Ofgem and Elexon Total | Latest rolling 12-month capacity factor 39.2% | Life capacity factor 38.6% | Age (y) . | Installed capacity (MWp) 16,076 | Total elec. gen. (GWh) 441,929 | Power per unit area spanned (W/m2) 1.6 | Rolling annual capacity factors (click to enlarge) 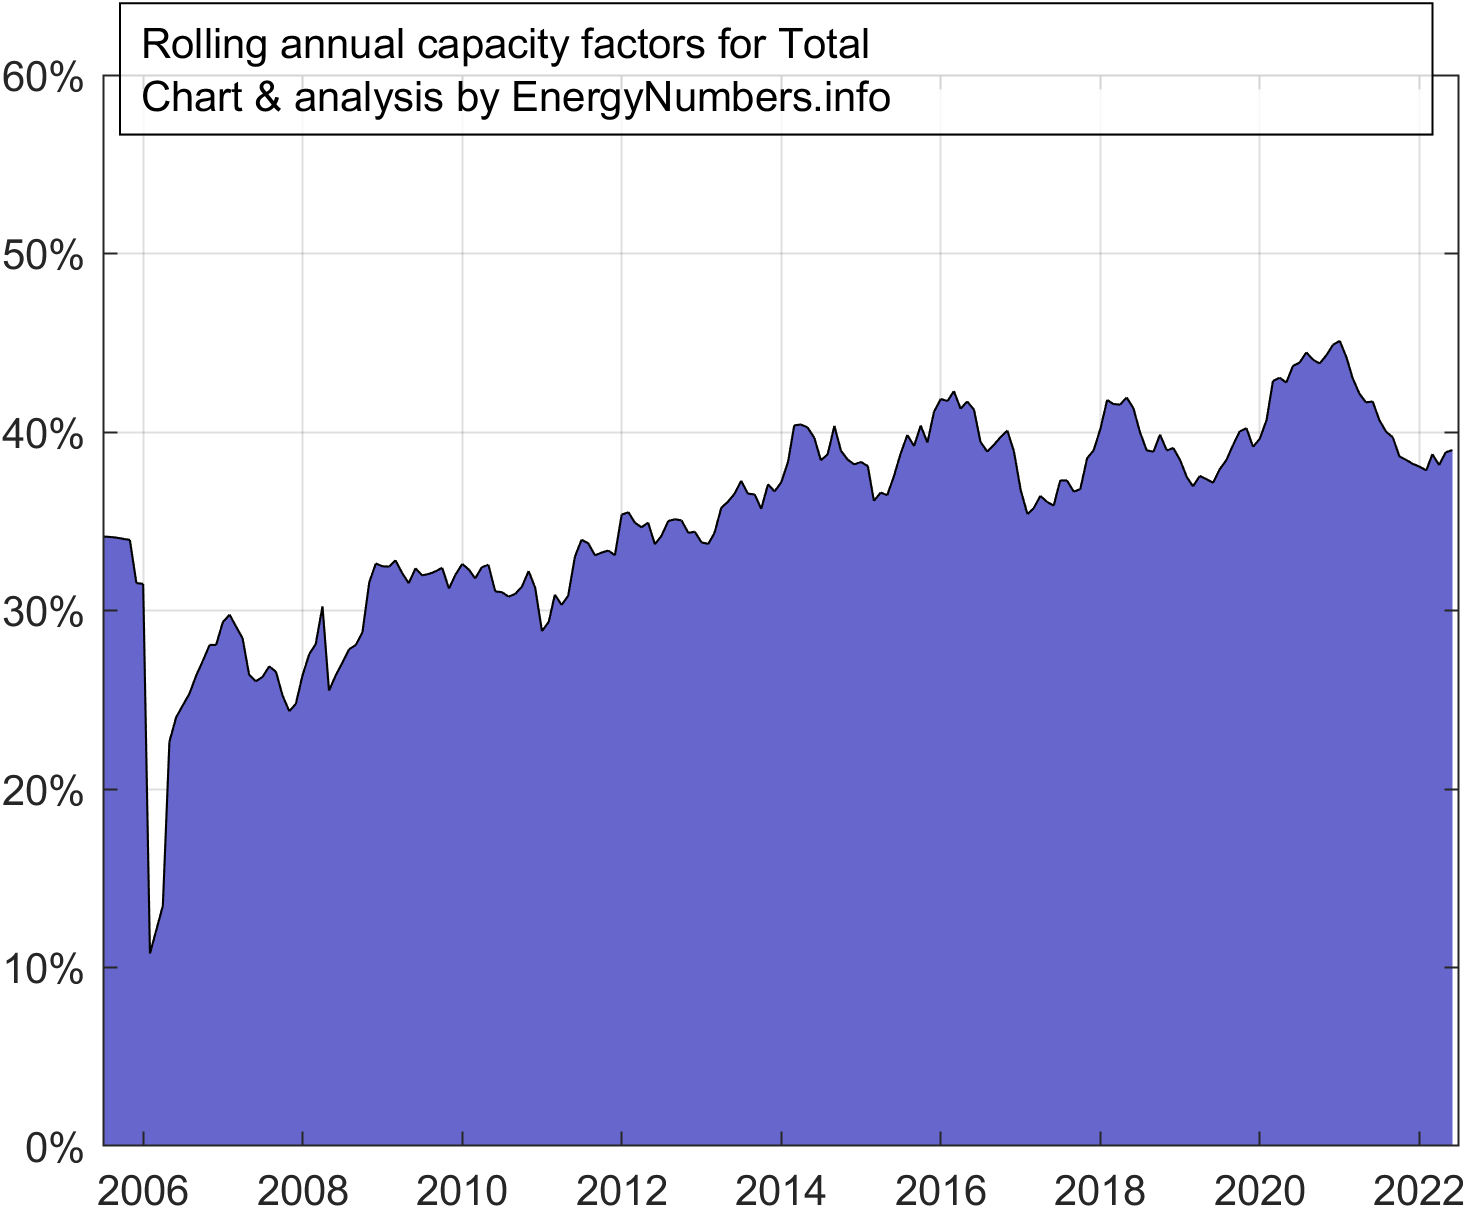 |
|---|---|---|---|---|---|---|---|
| Aberdeen EOWDC | 39.6% | 35.7% | 8.2 | 93 | 2,383 | 1.7 | 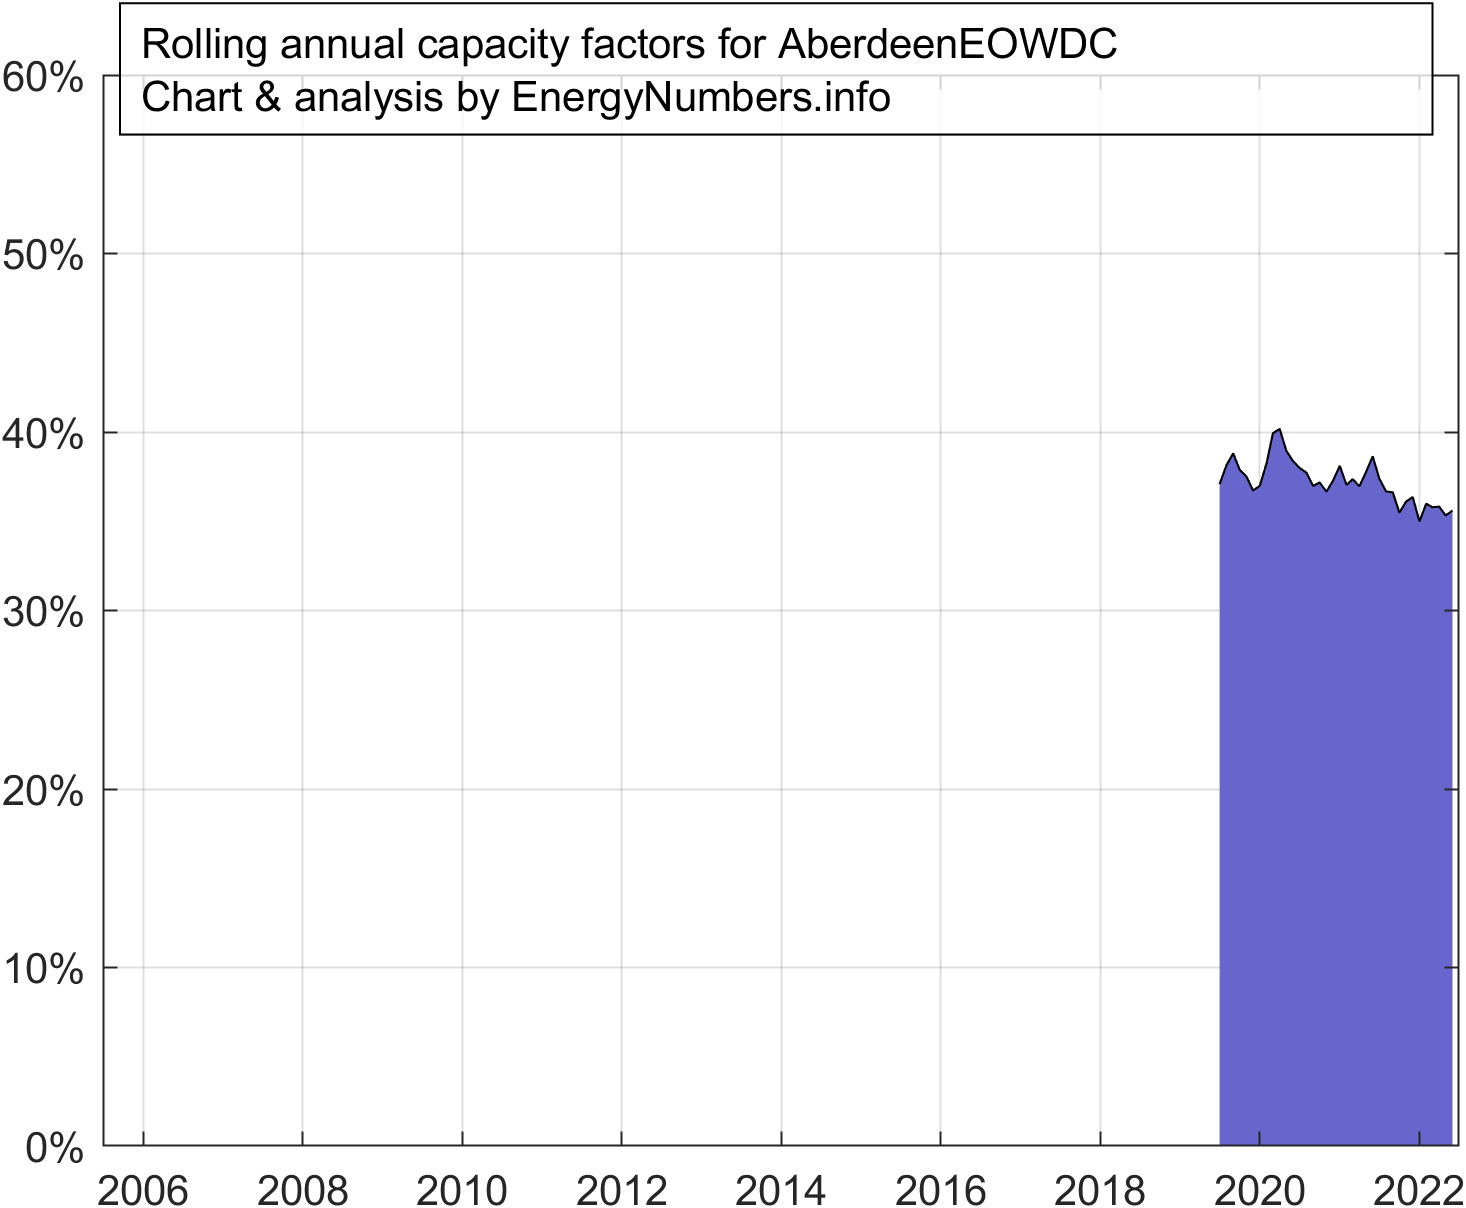 |
| Barrow | 24.4% | 33.7% | 19.9 | 90 | 5,314 | 3.0 | 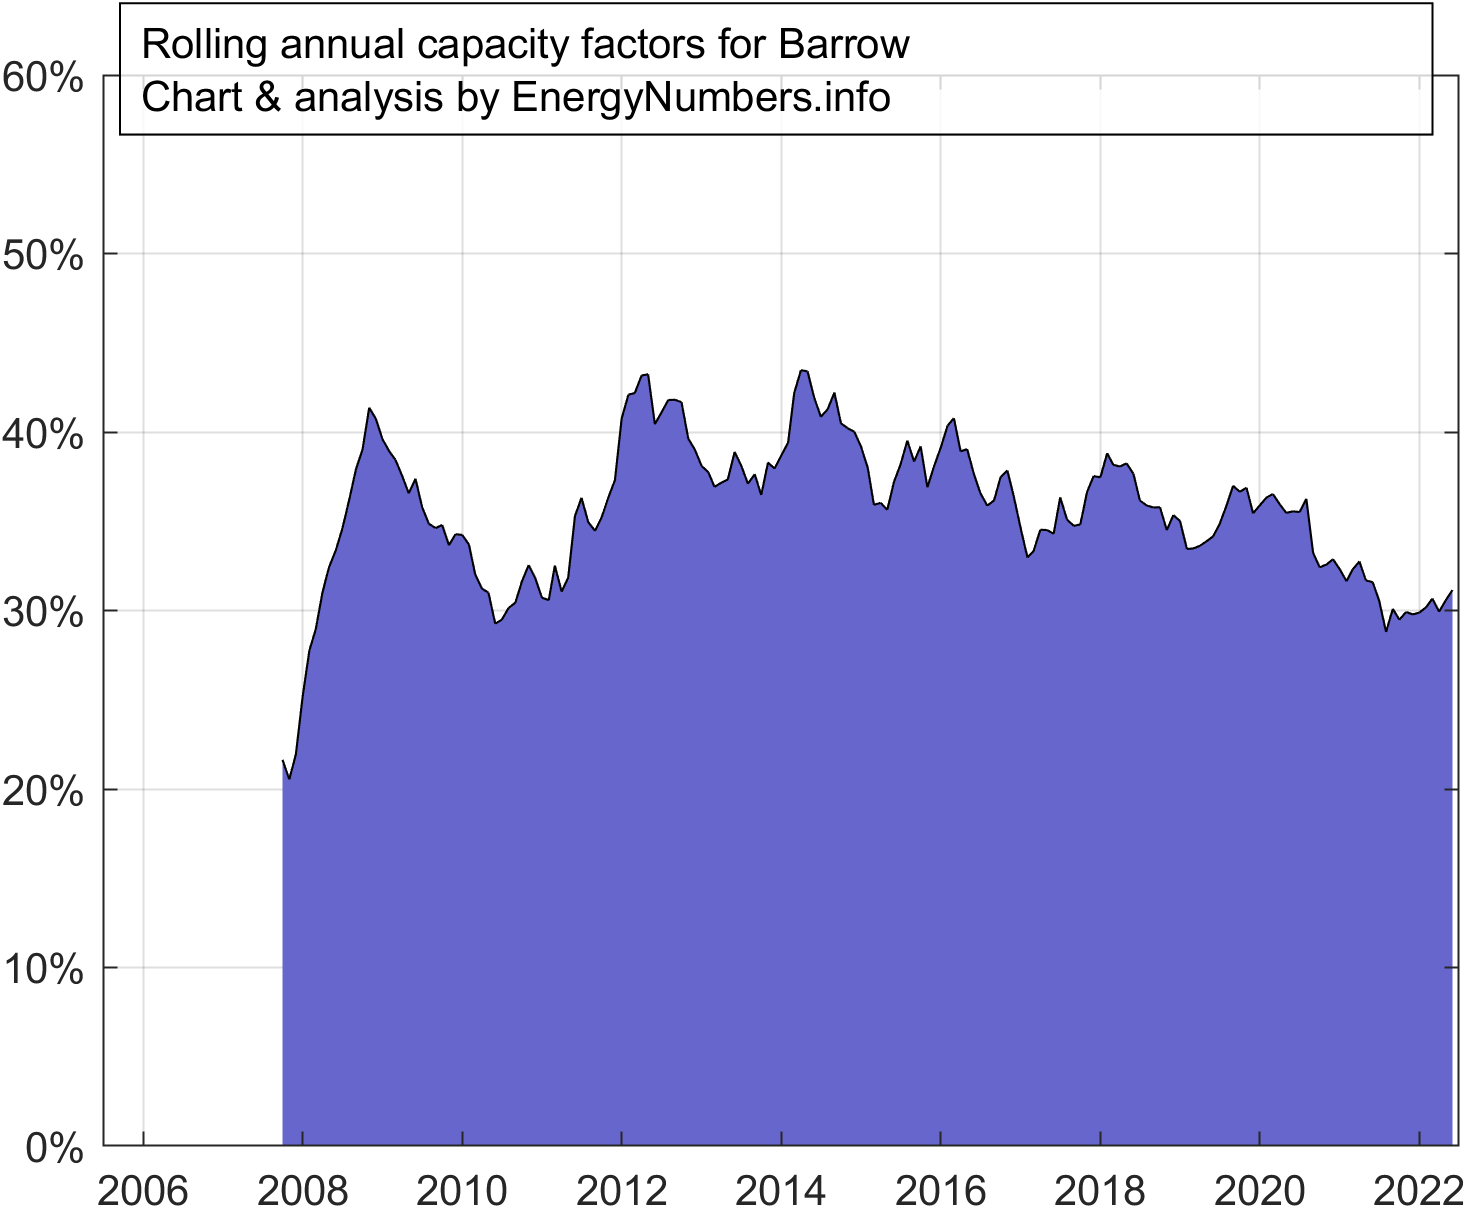 |
| Beatrice | 44.4% | 40.1% | 7.2 | 588 | 15,168 | 1.8 |  |
| Burbo Bank | 35.0% | 32.6% | 18.9 | 90 | 4,866 | 2.9 | 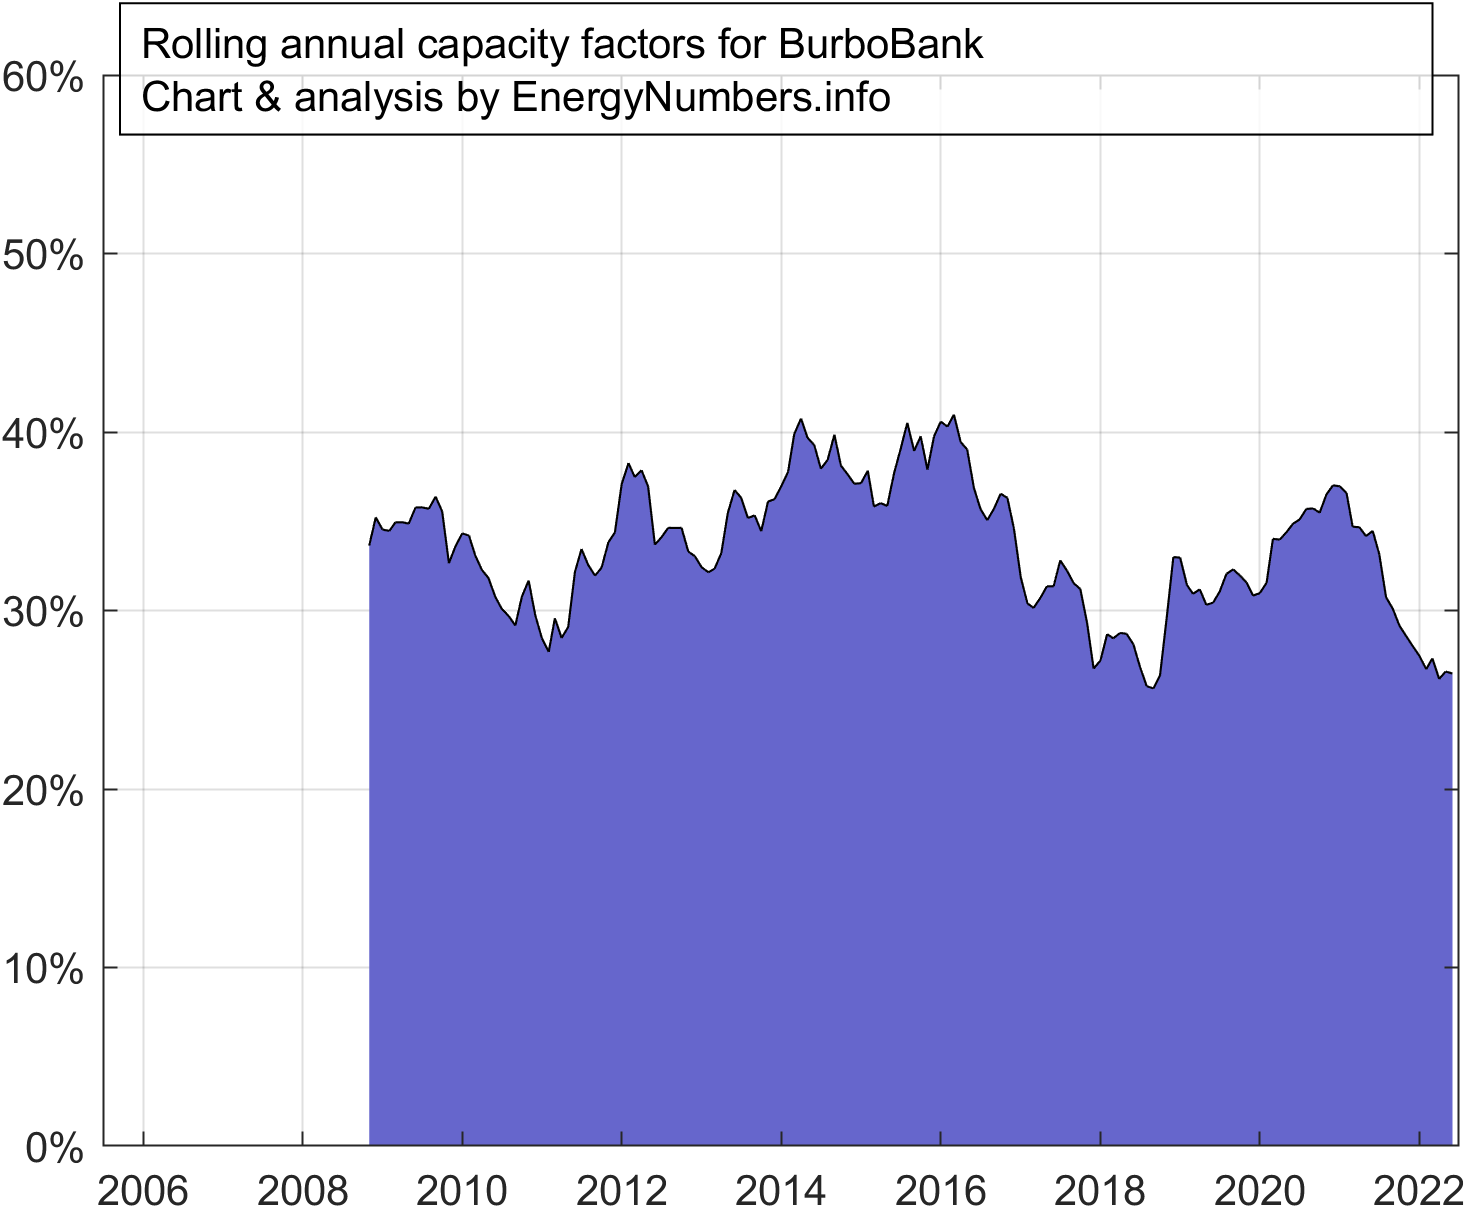 |
| Burbo Bank 2 | 40.3% | 39.4% | 9.4 | 254 | 8,275 | 2.5 | 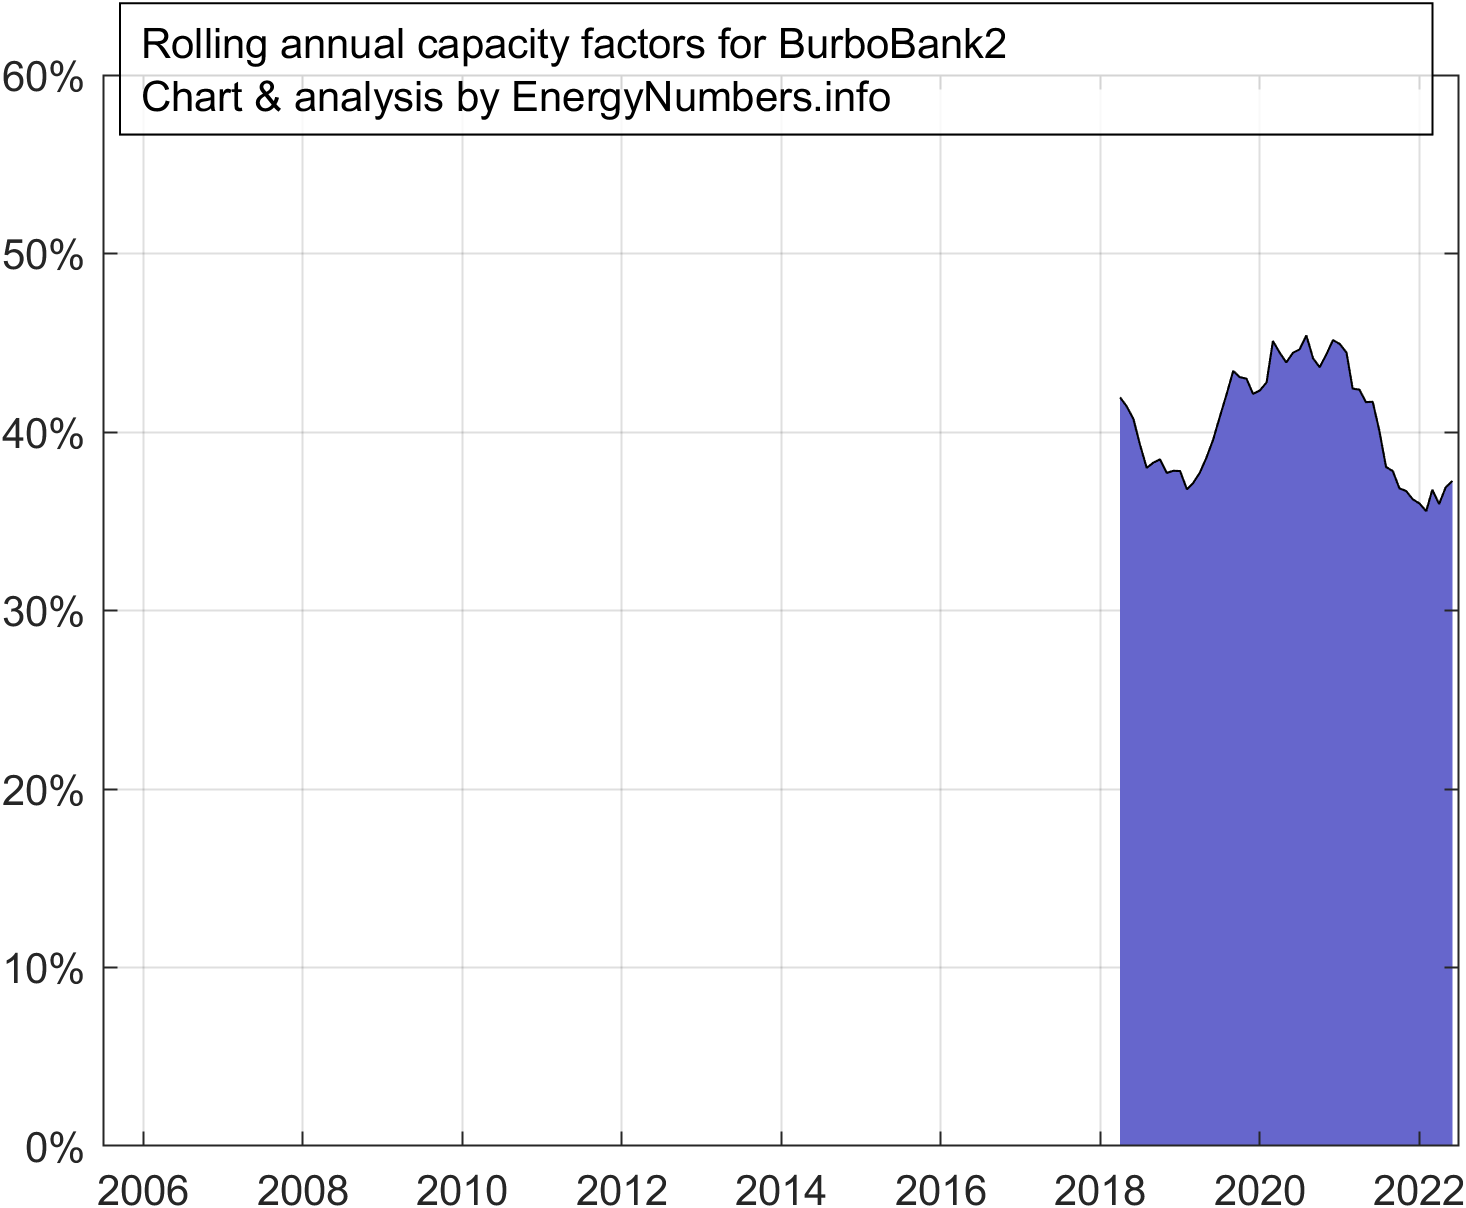 |
| Dudgeon | 49.8% | 46.3% | 8.9 | 402 | 14,551 | 3.4 | 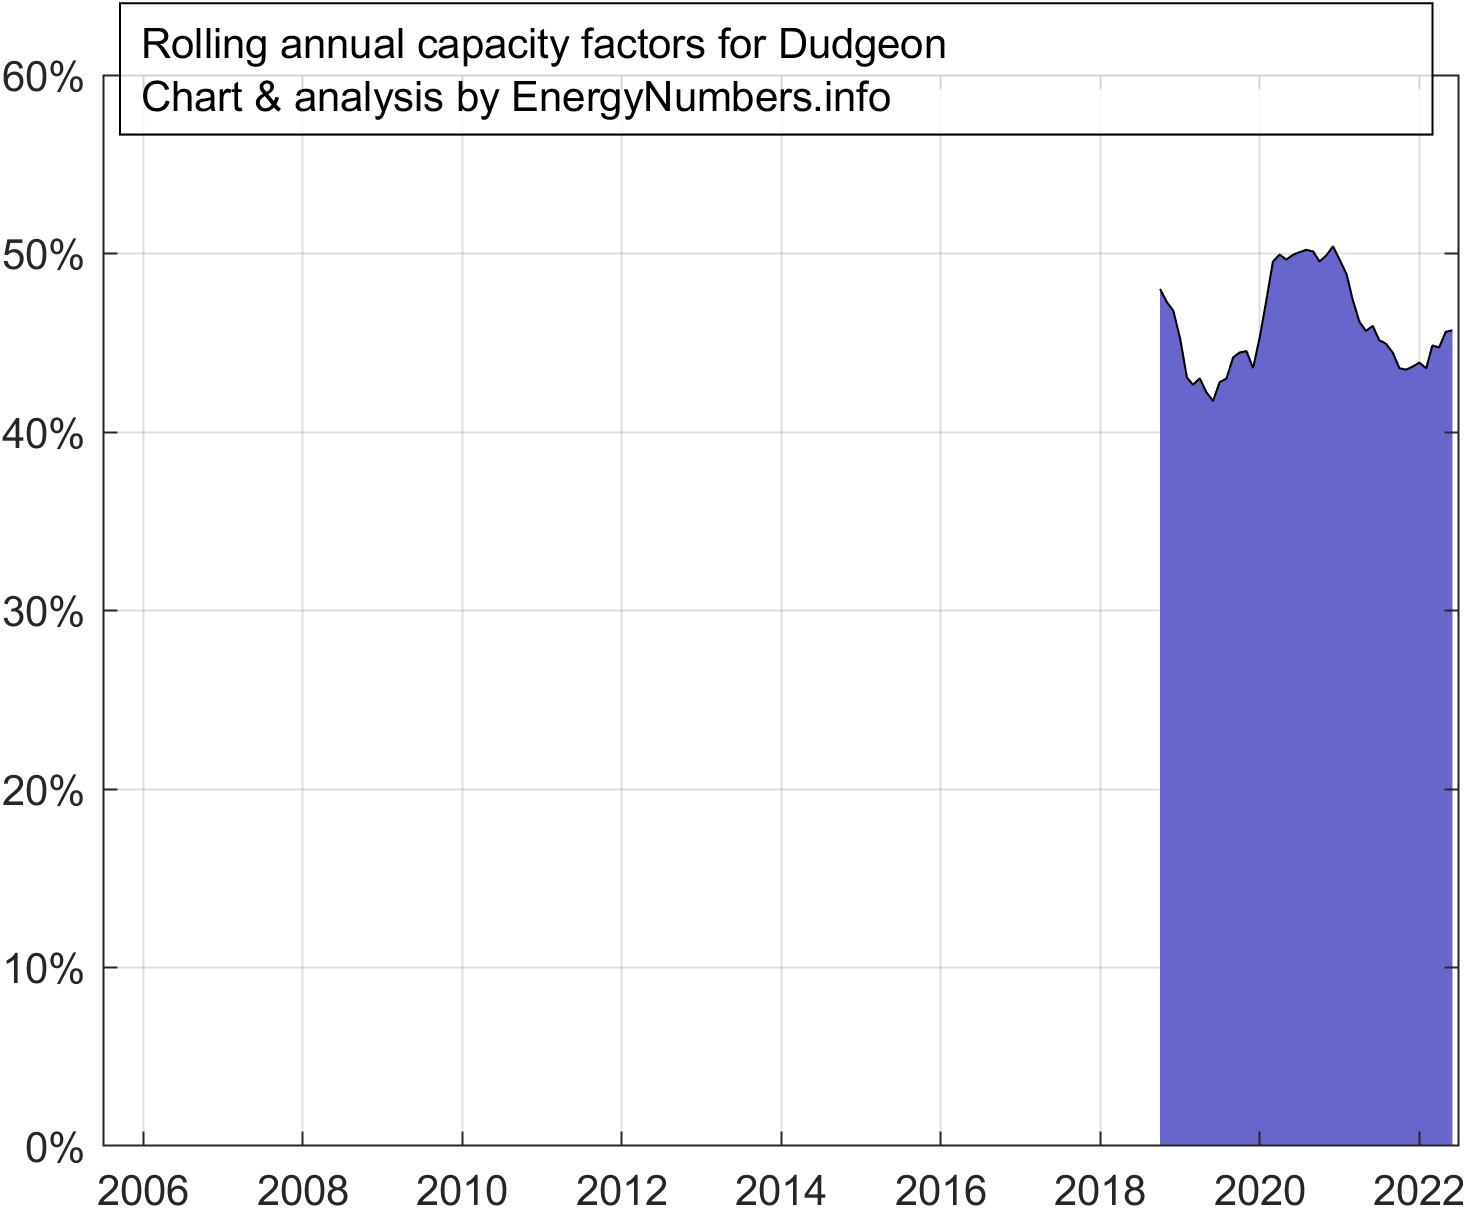 |
| East Anglia ONE | 48.6% | 44.1% | 6.1 | 714 | 17,030 | 1.9 | 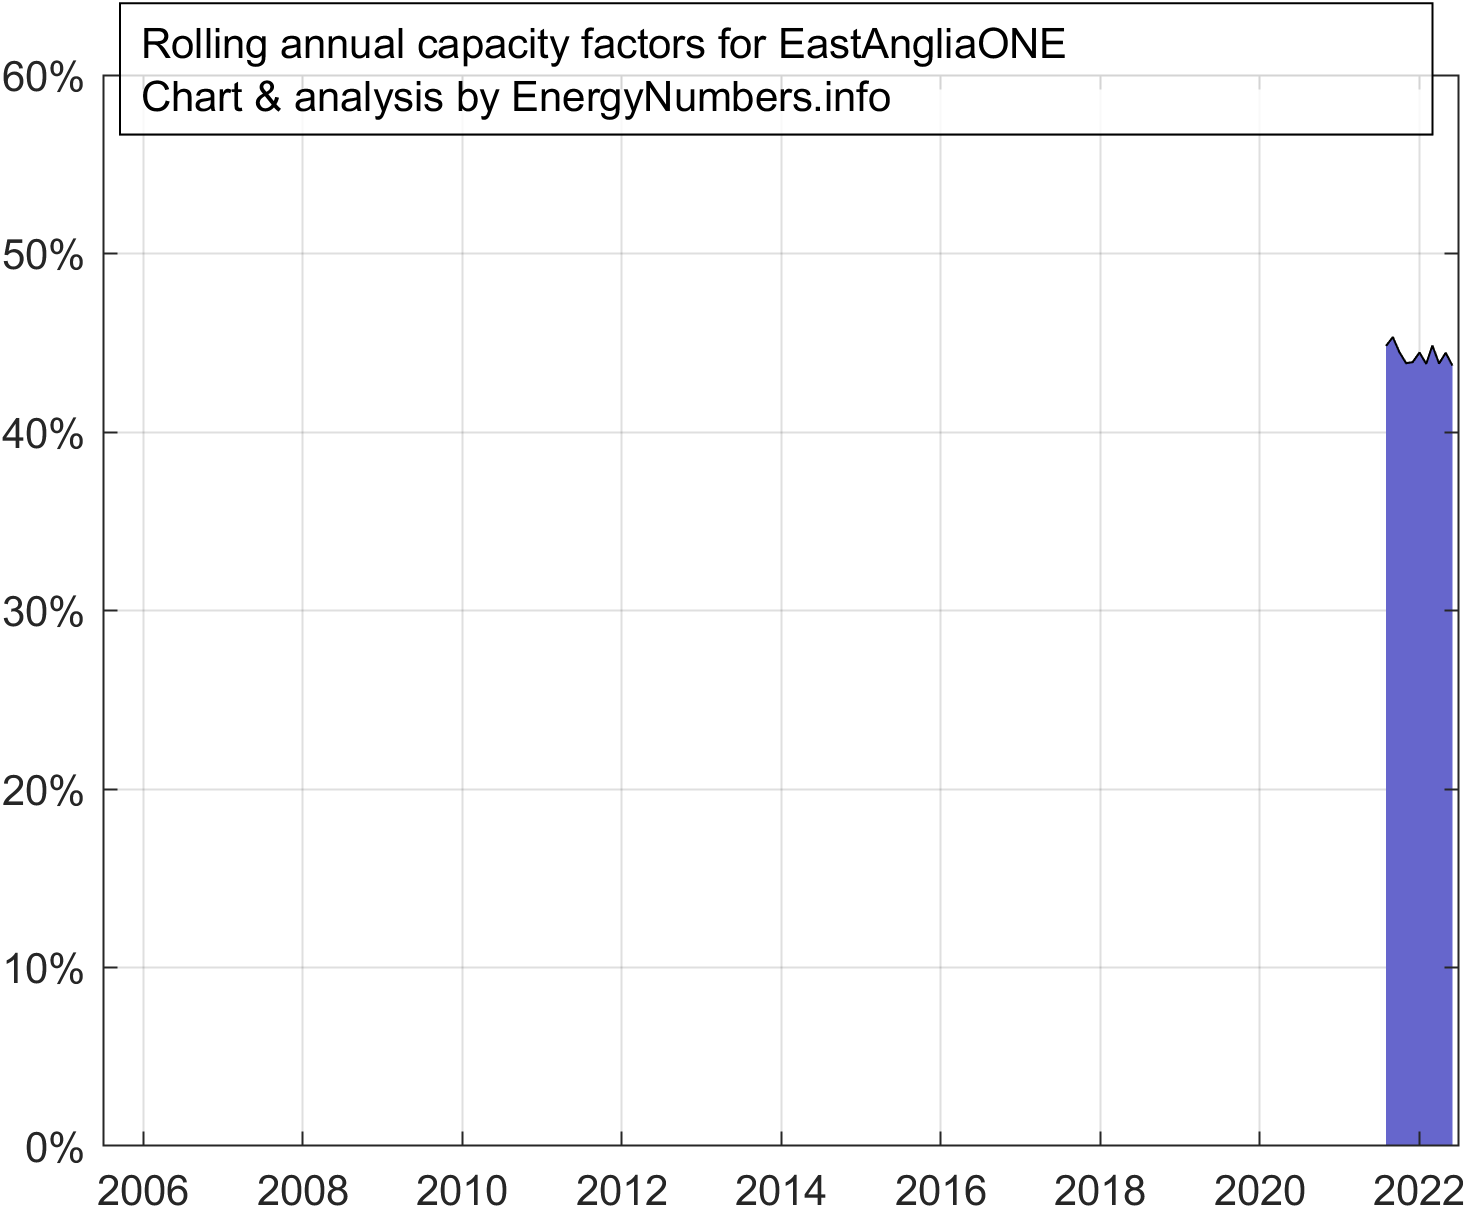 |
| Galloper | 49.6% | 47.0% | 8.4 | 353 | 12,236 | 1.5 | 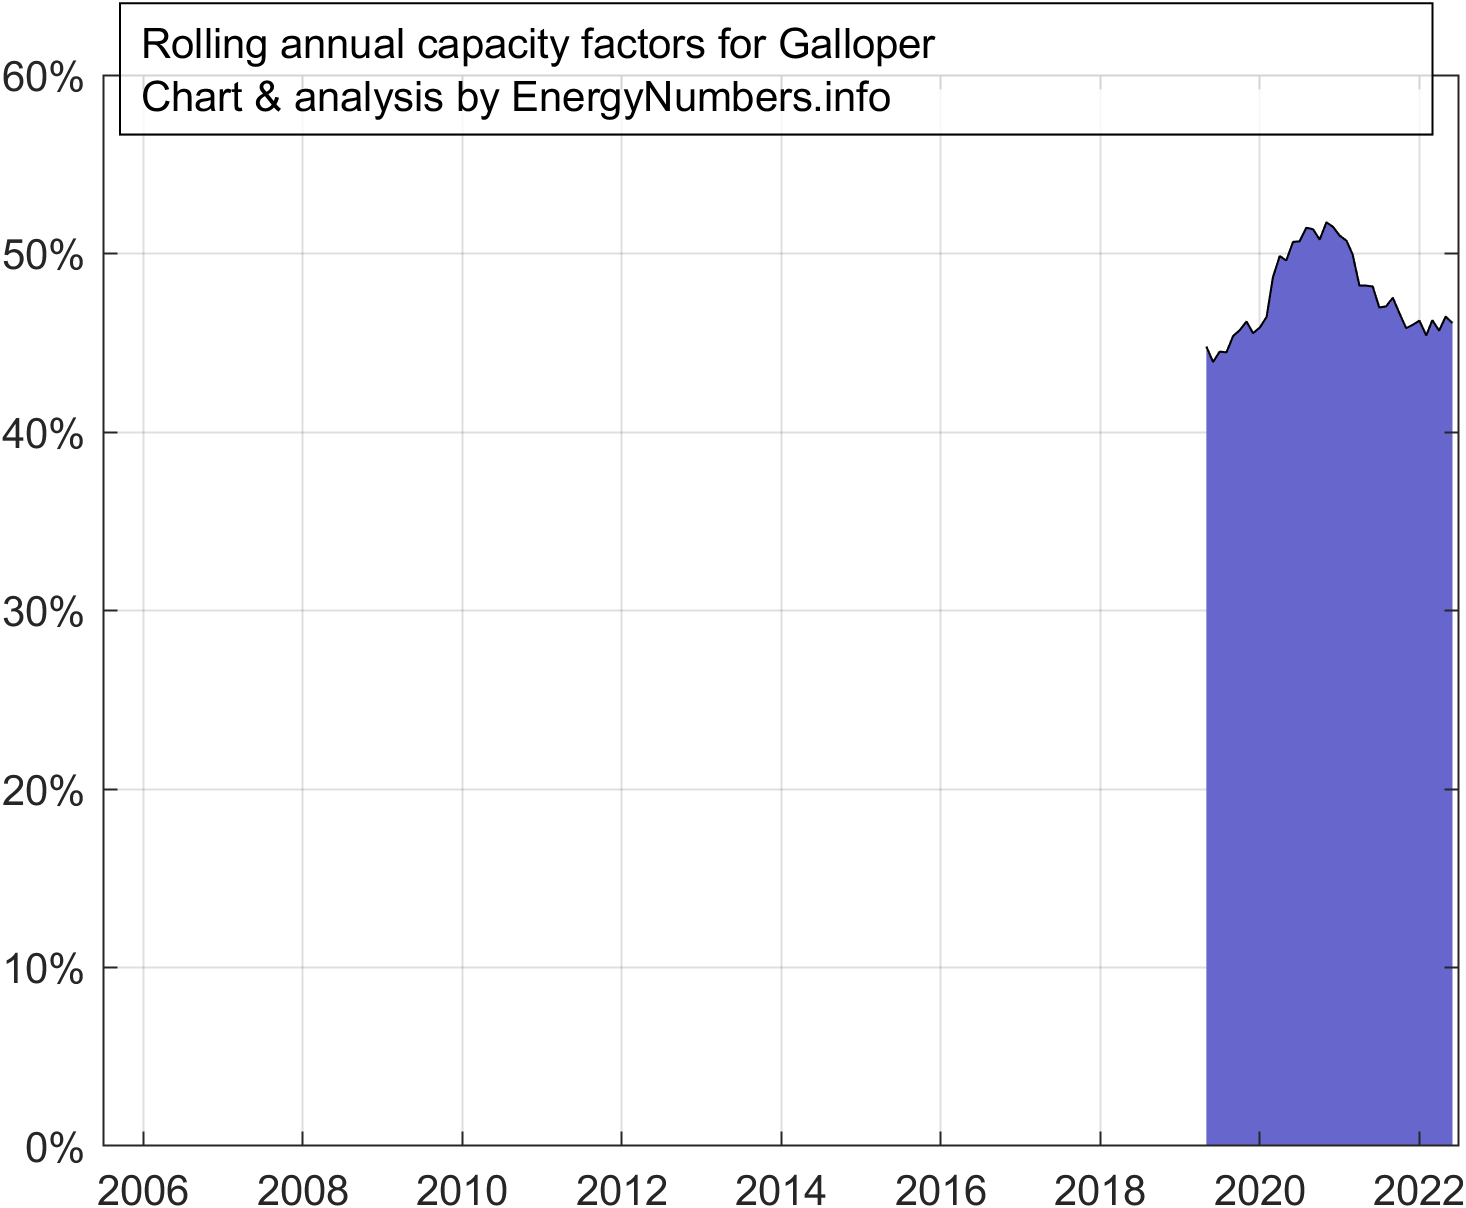 |
| Greater Gabbard | 39.8% | 39.4% | 13.1 | 504 | 22,804 | 1.4 | 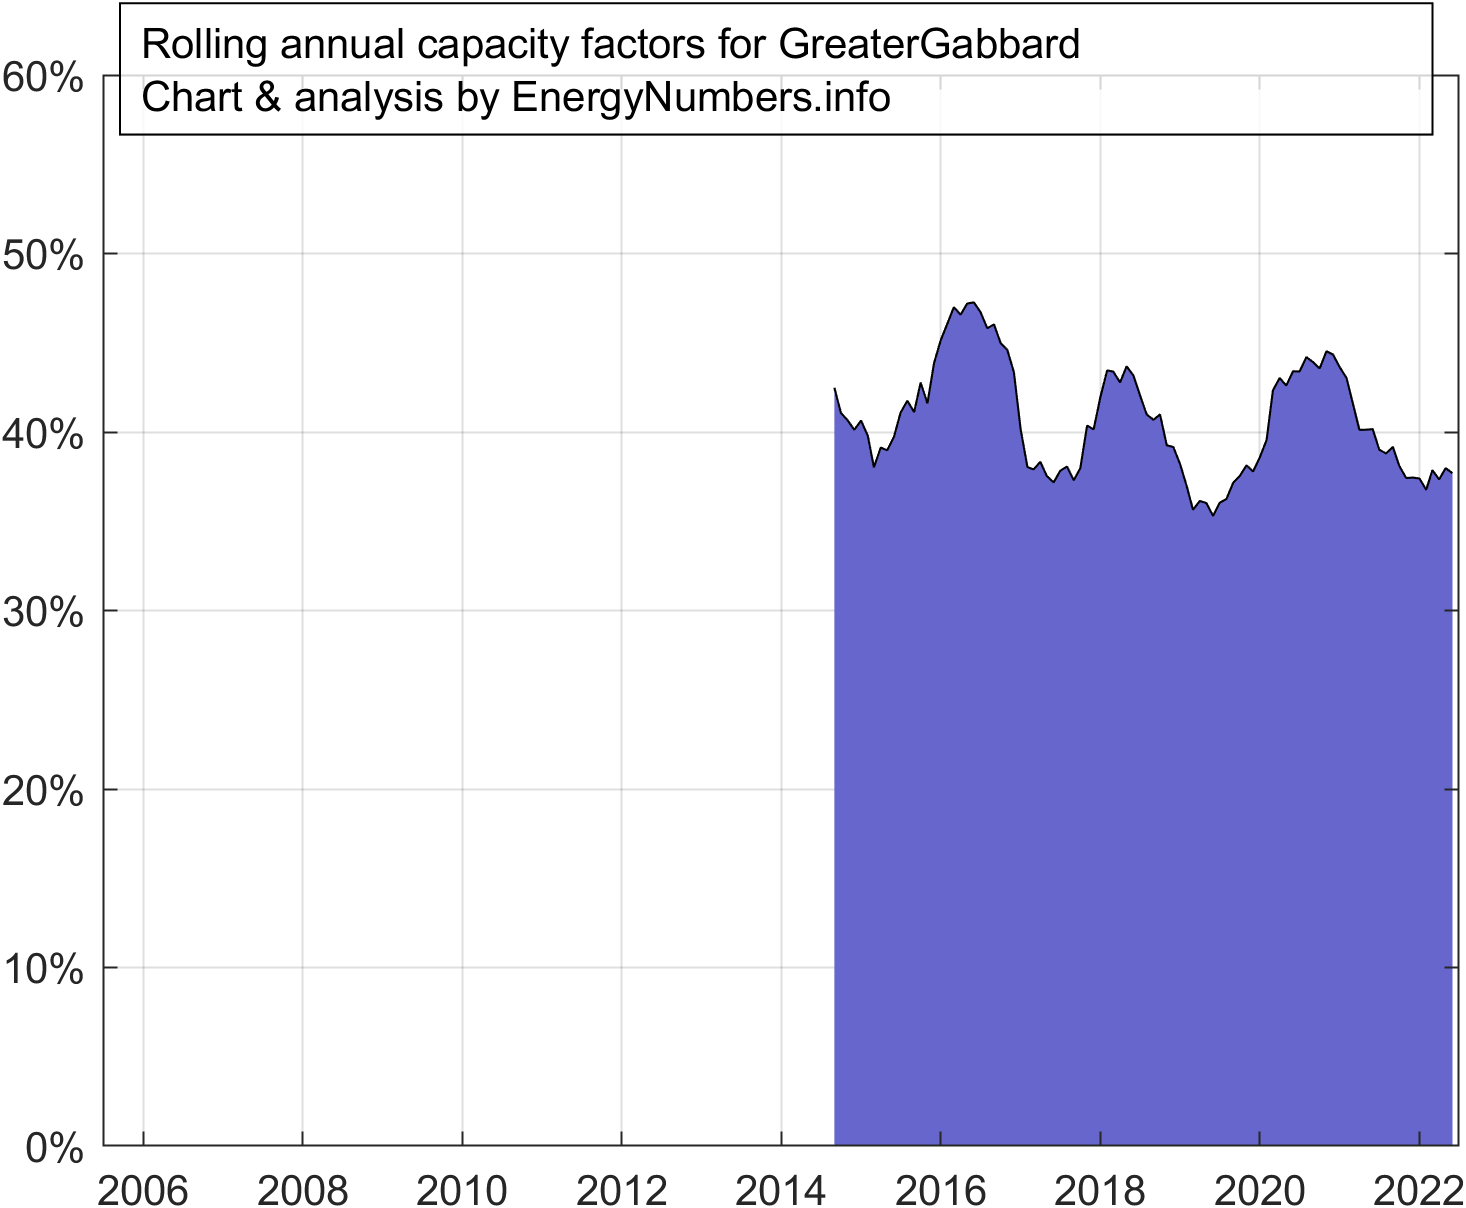 |
| Gunfleet Sands | 34.0% | 35.9% | 16.2 | 173 | 8,843 | 3.9 | 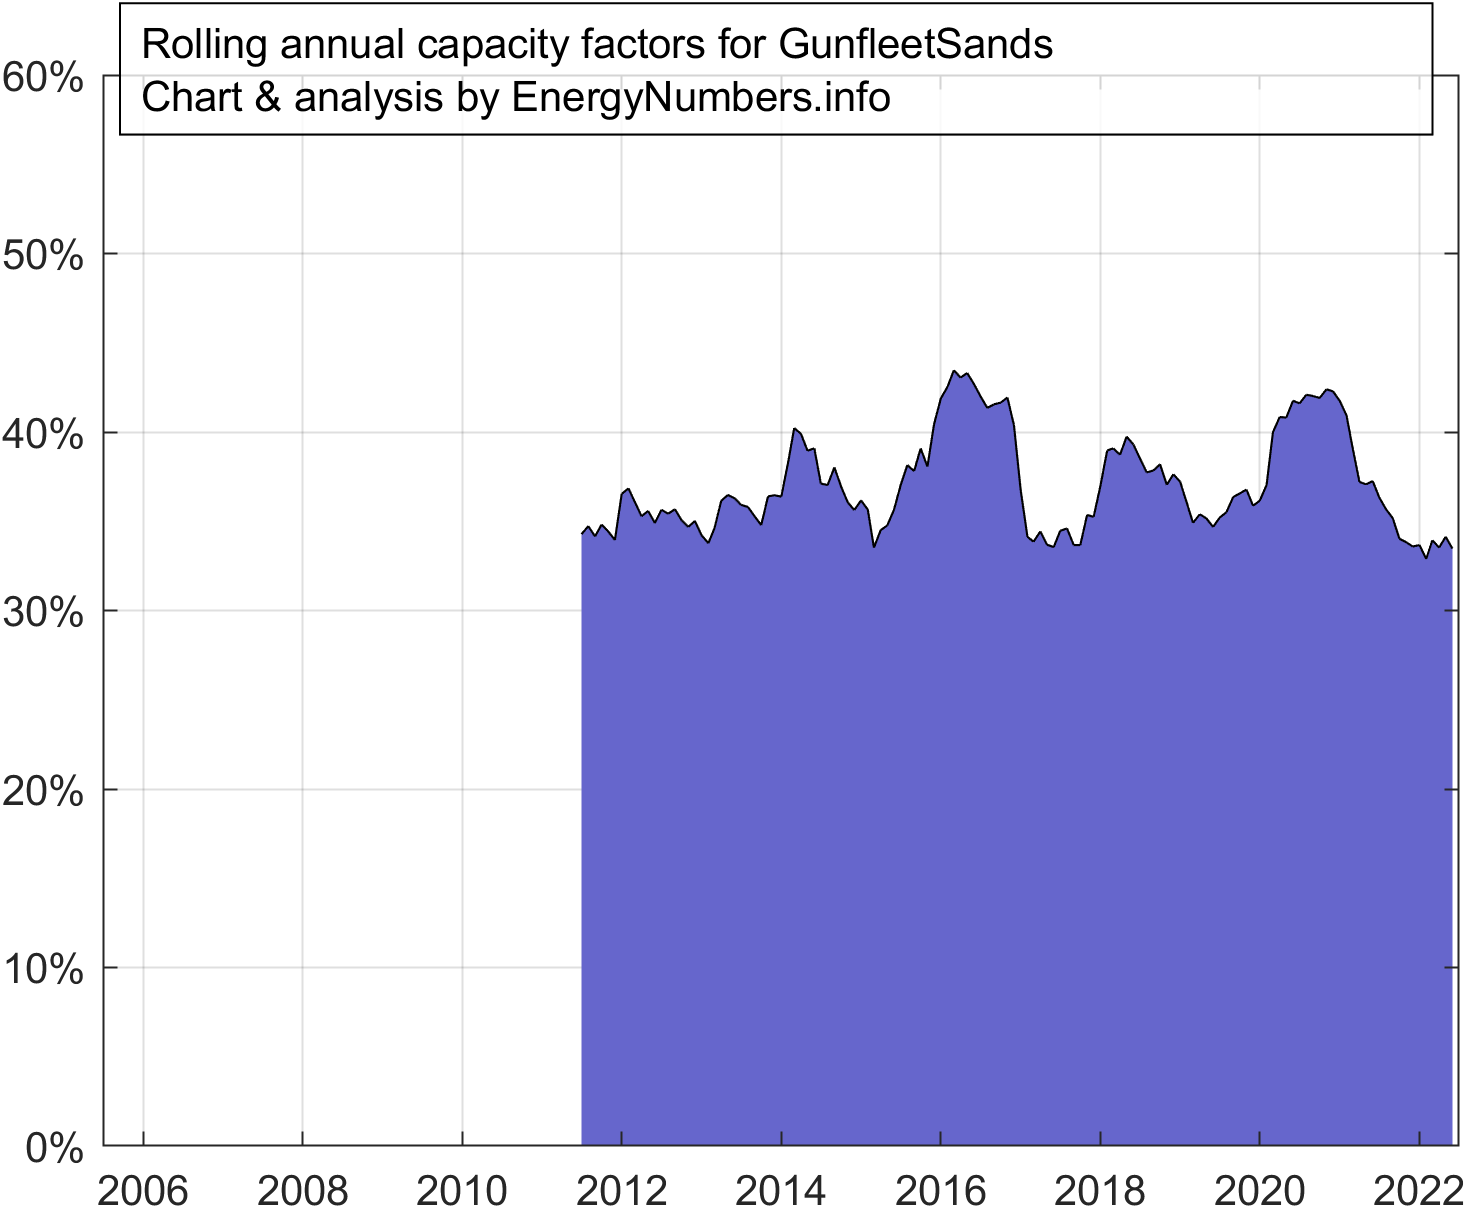 |
| Gwynt-y-Mor | 37.7% | 33.5% | 11.2 | 576 | 19,057 | 2.8 | 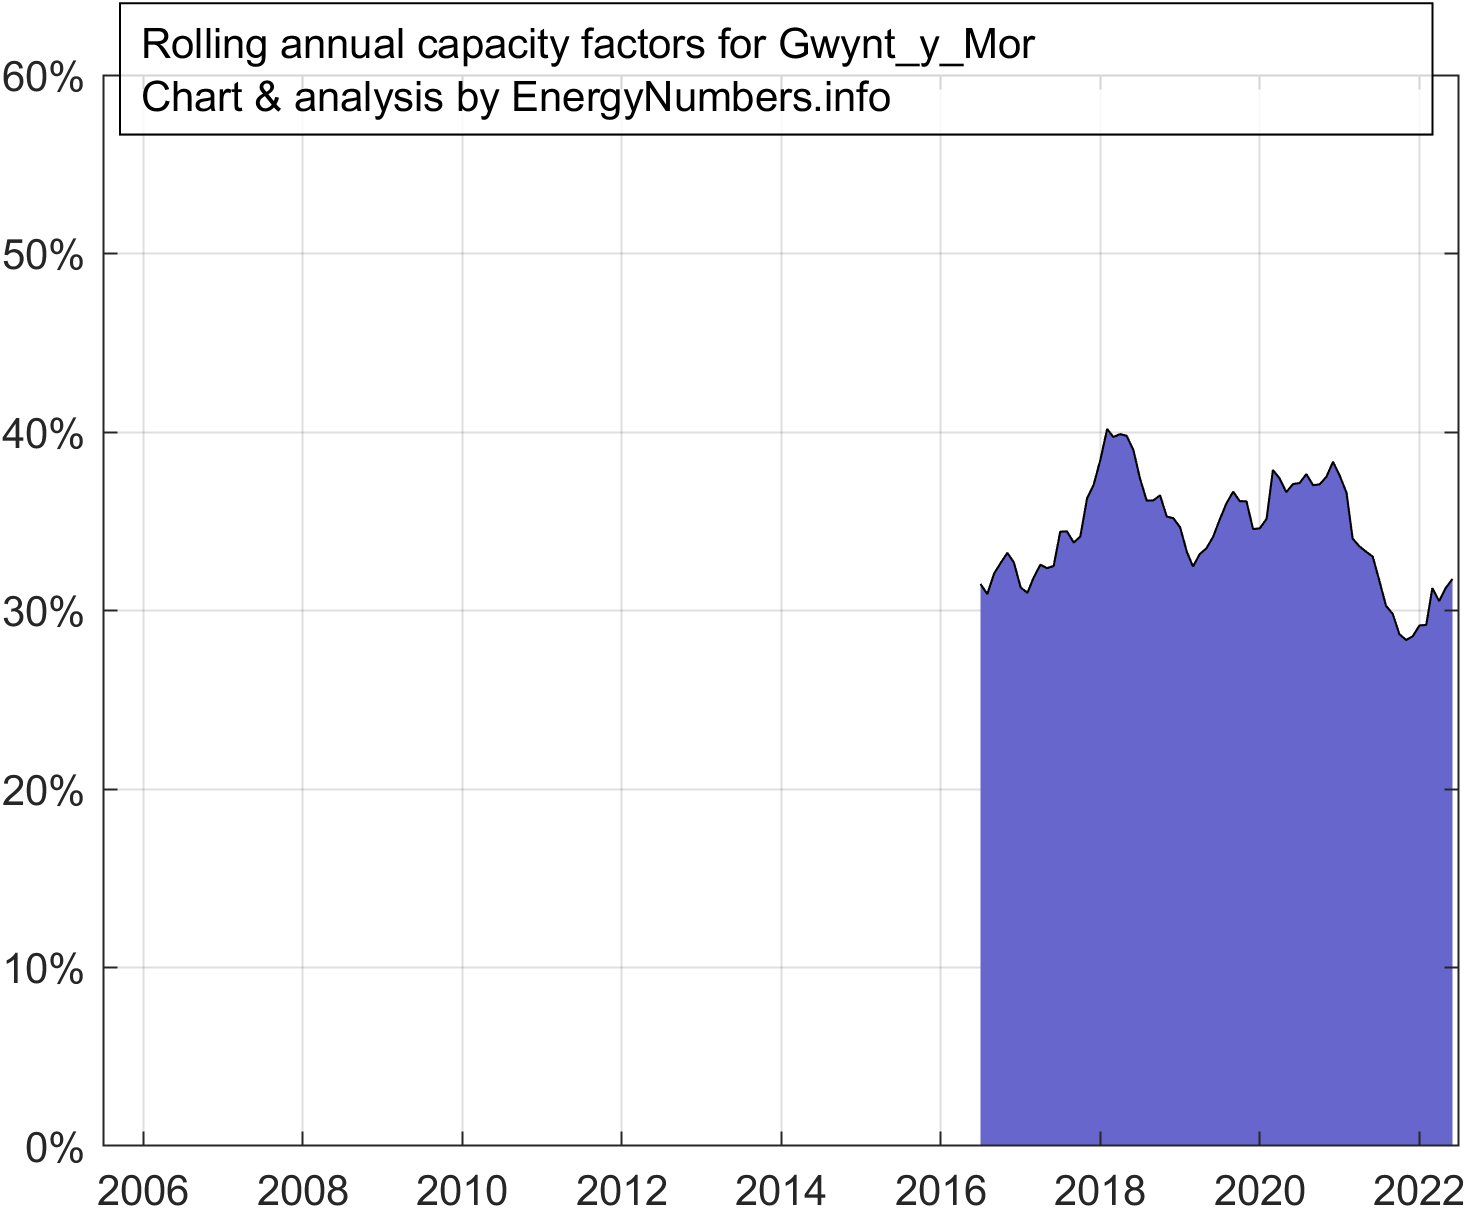 |
| Hornsea One | 49.4% | 45.7% | 6.7 | 1,218 | 32,962 | 1.4 |  |
| Humber Gateway | 44.2% | 42.2% | 11.2 | 219 | 9,188 | 3.4 | 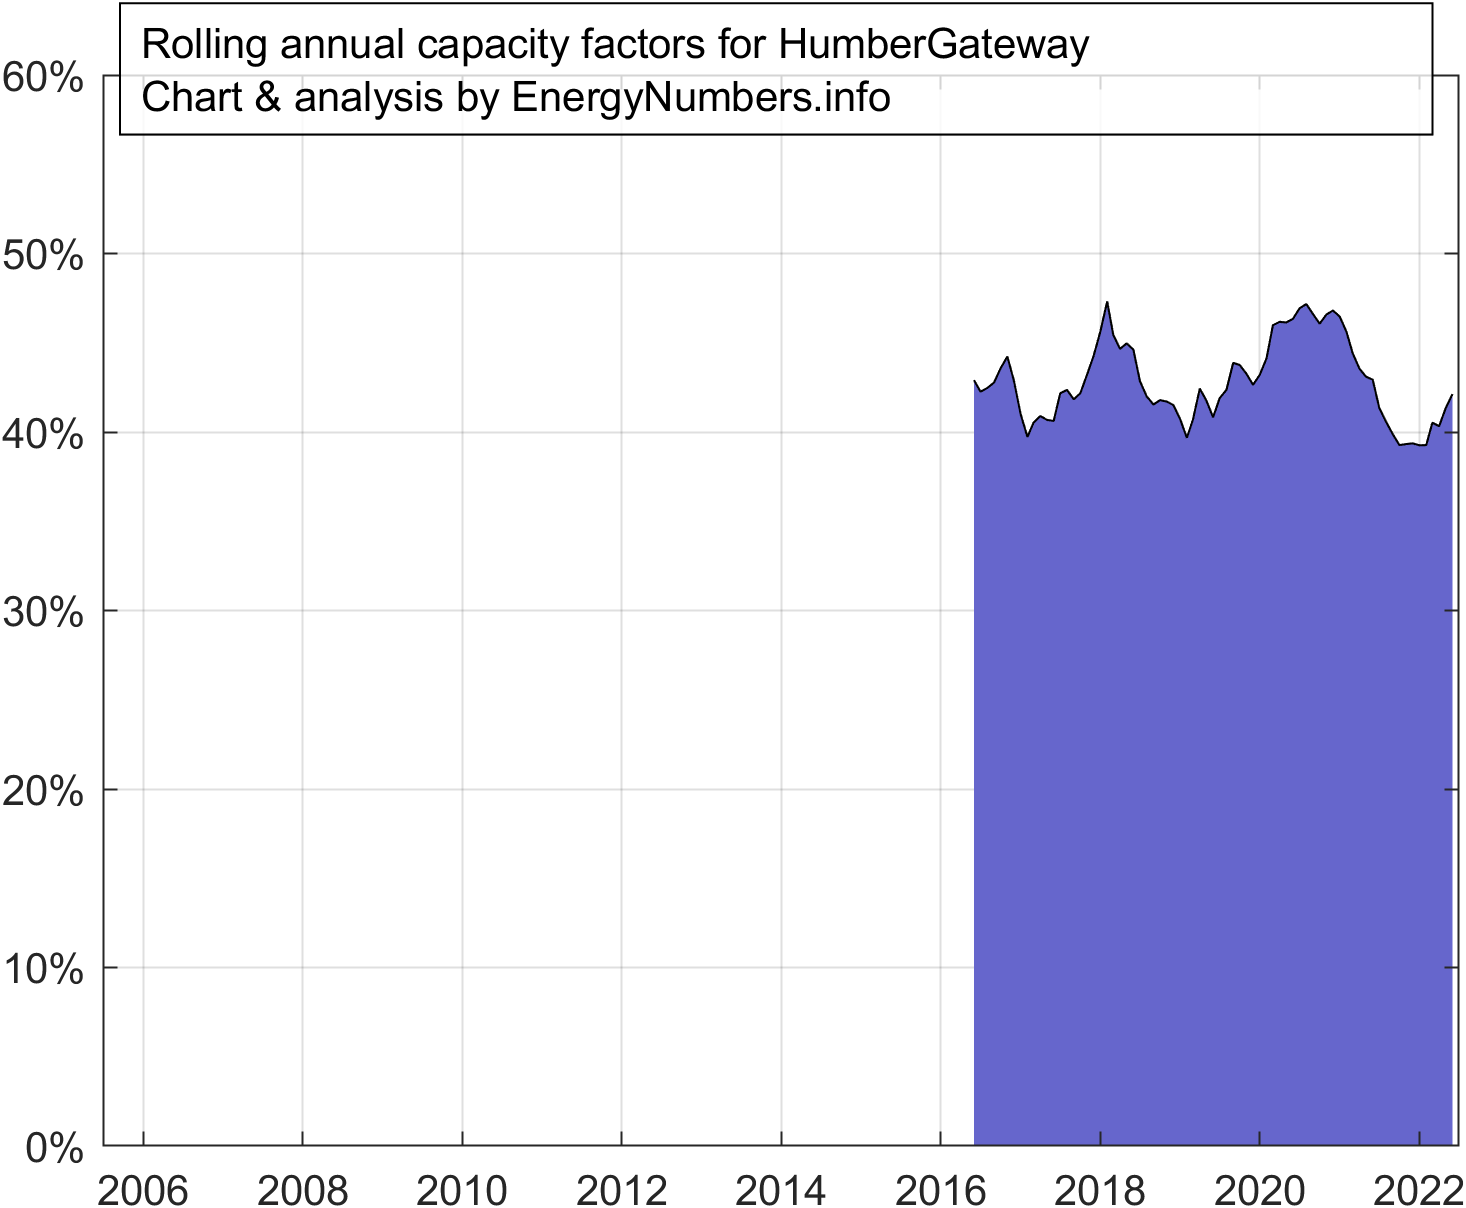 |
| Hywind Scotland | 51.4% | 48.6% | 8.9 | 30 | 1,141 | 1.0 | 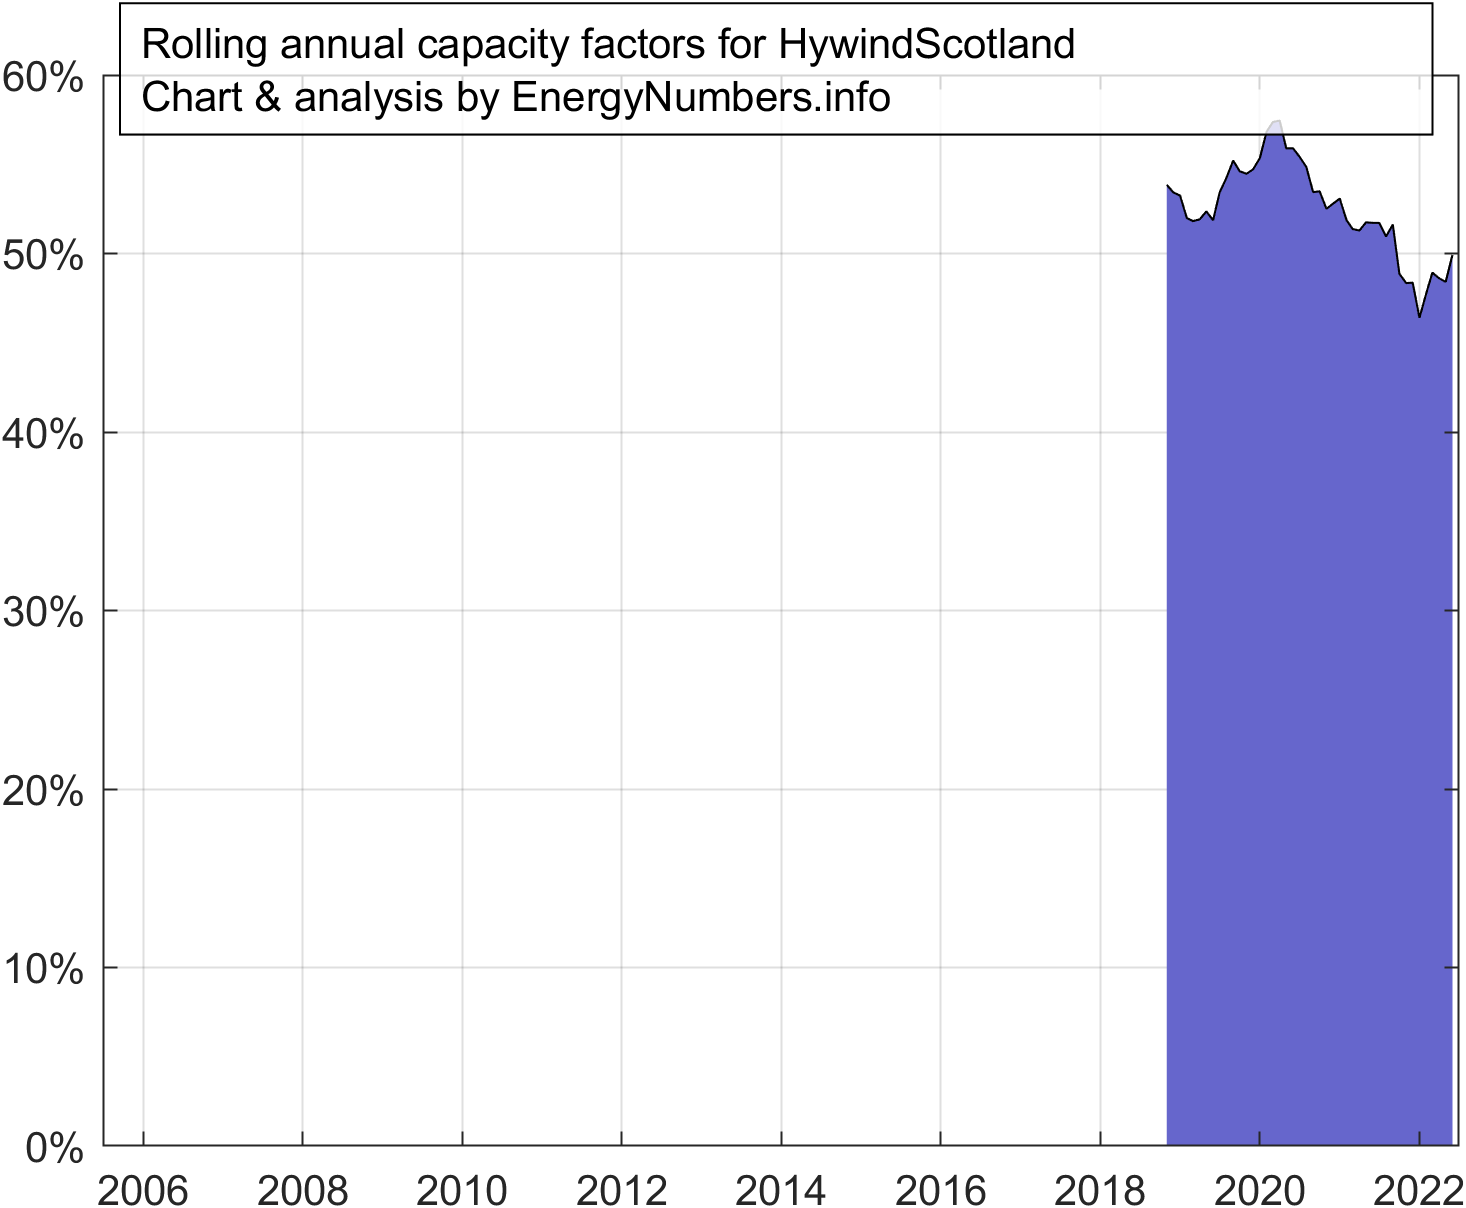 |
| Lincs | 44.4% | 41.6% | 12.9 | 270 | 12,814 | 2.7 | 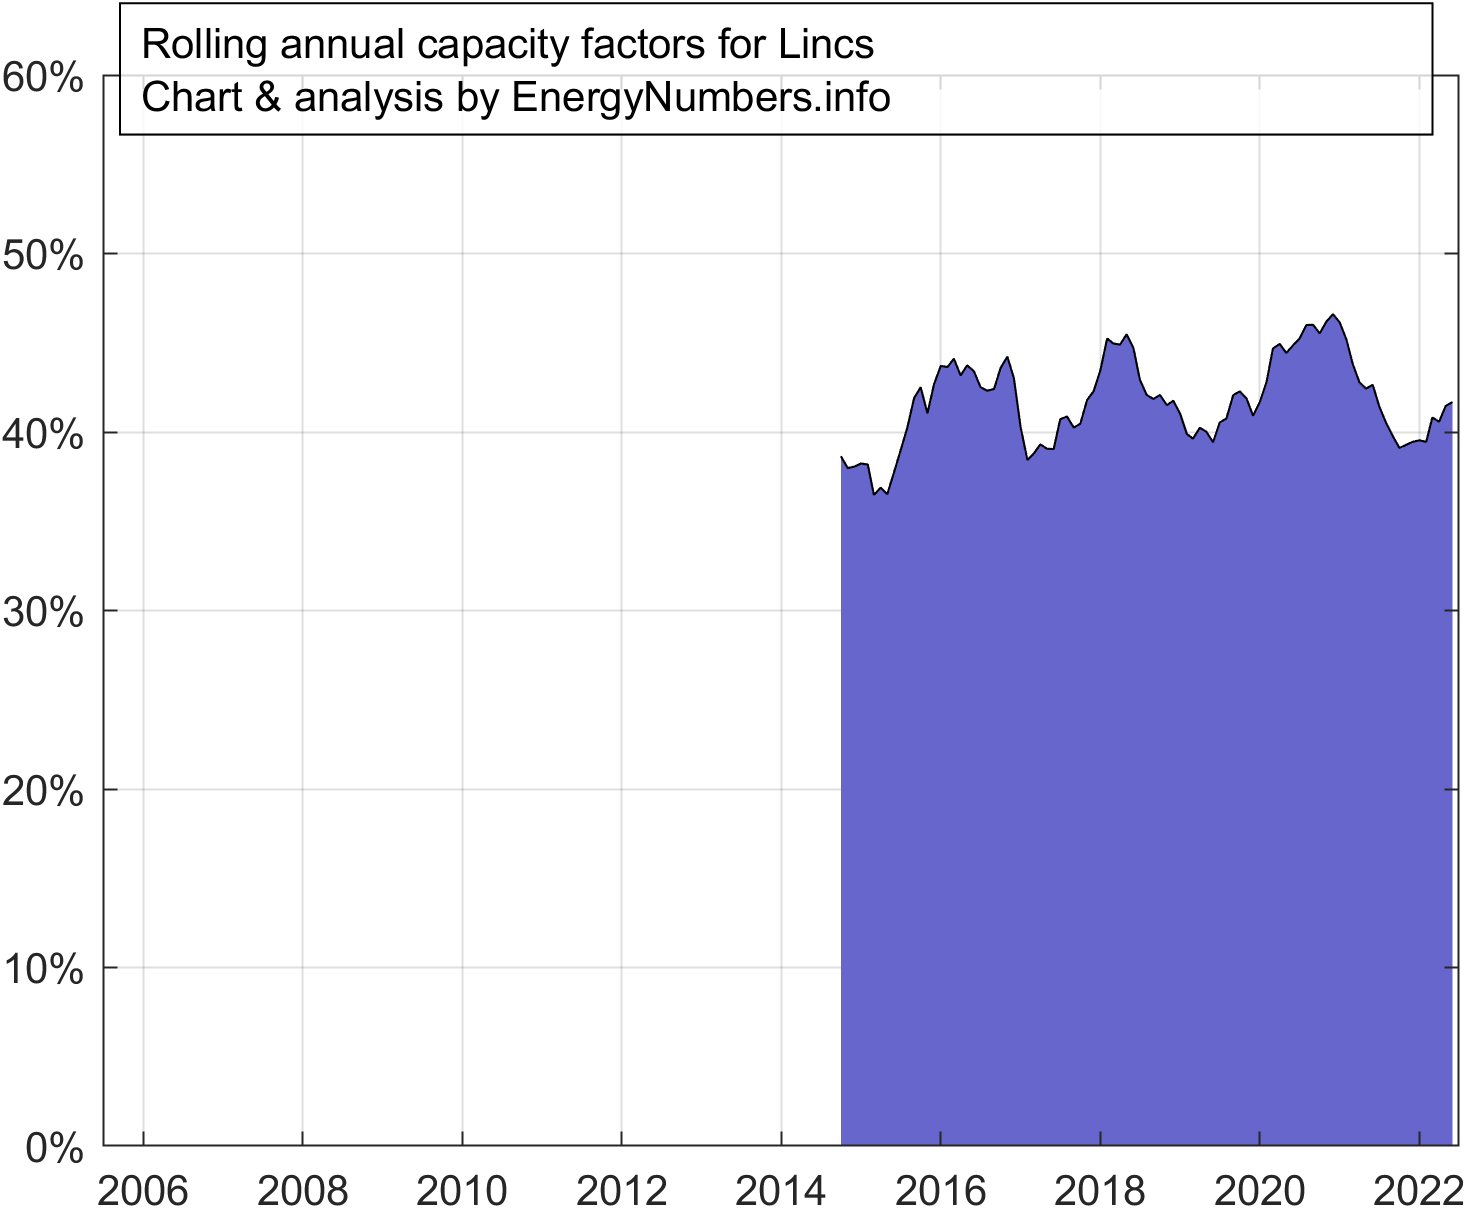 |
| London Array | 44.1% | 40.4% | 13.4 | 630 | 29,919 | 2.1 | 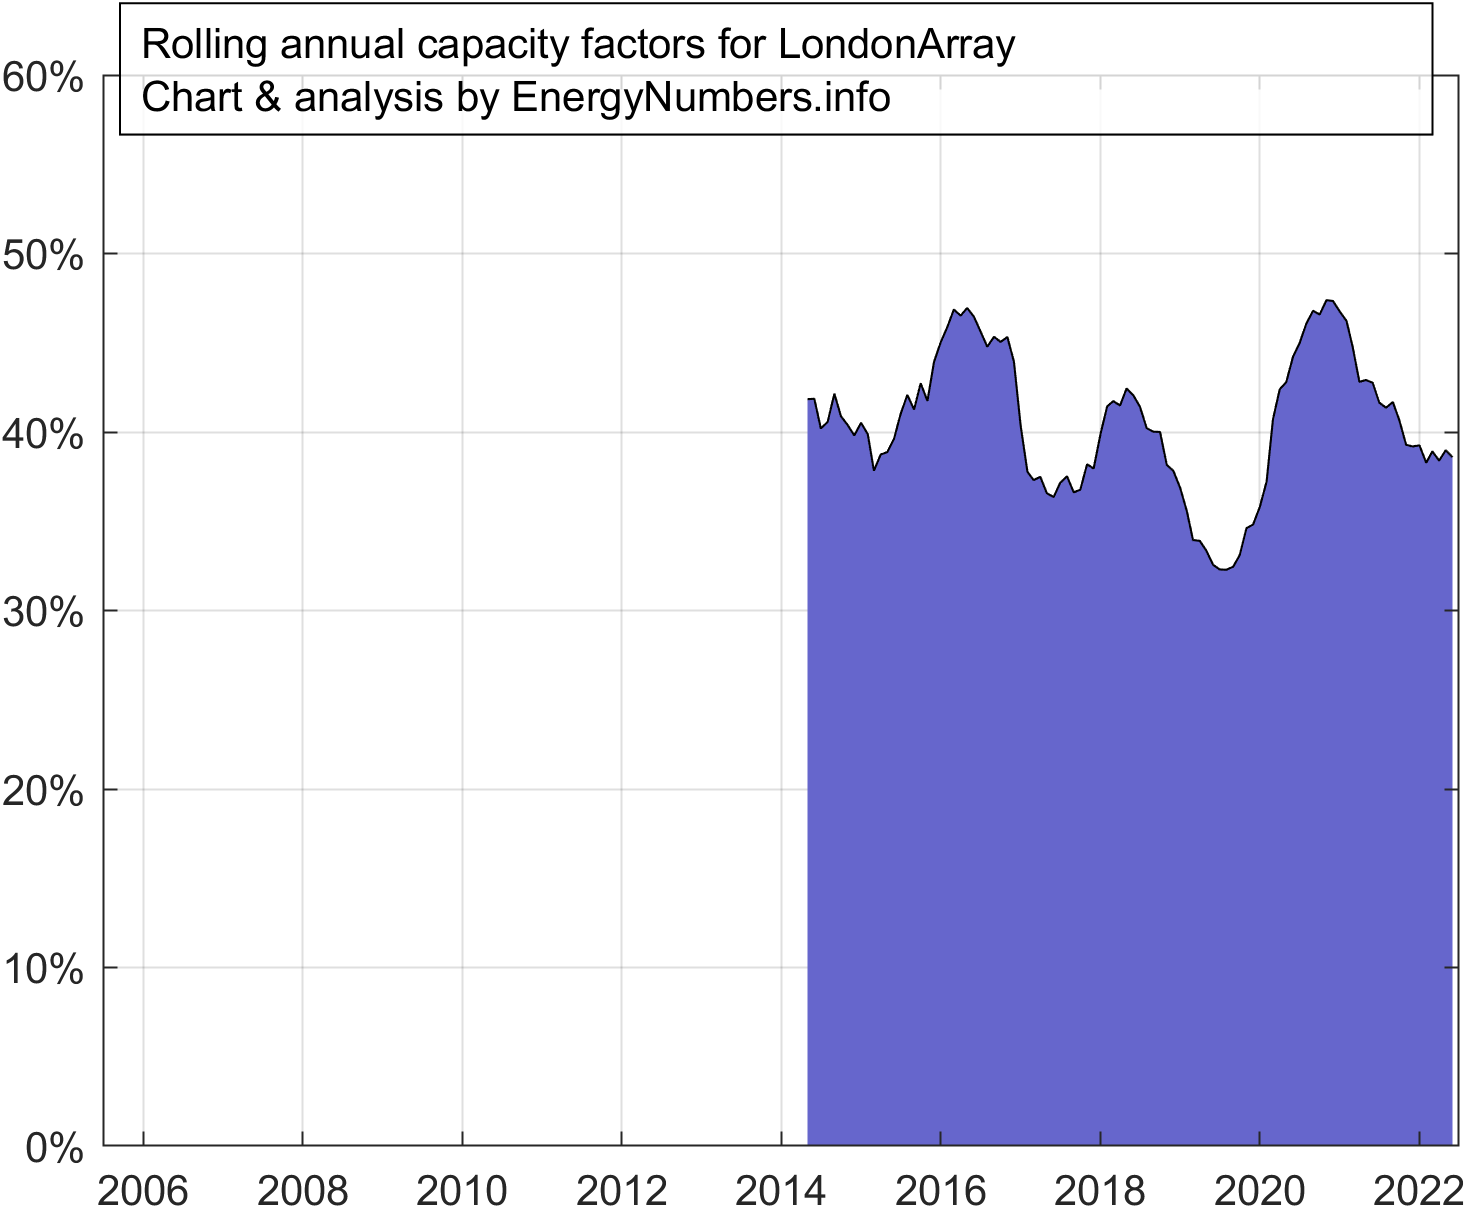 |
| Moray East | 18.1% | 22.1% | 4.4 | 950 | 8,145 | 0.7 |  |
| Ormonde | 35.9% | 34.5% | 14.5 | 150 | 6,610 | 5.2 | 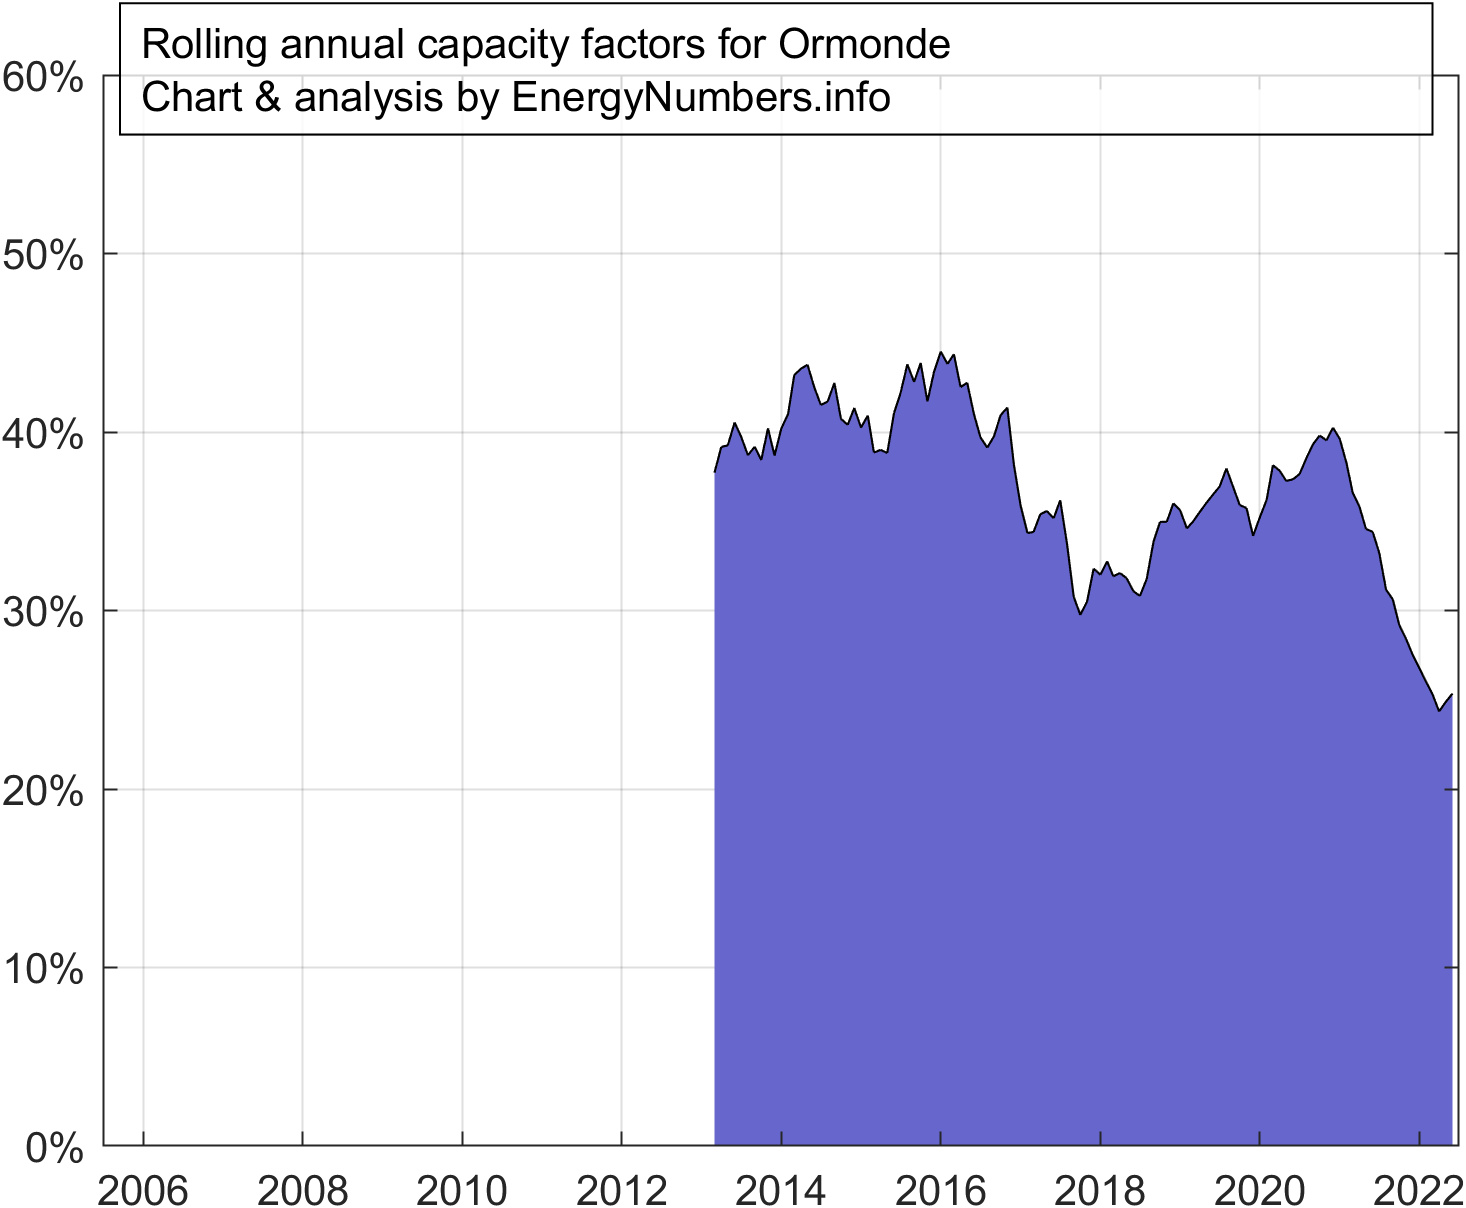 |
| Race Bank | 45.0% | 42.3% | 8.6 | 573 | 18,234 | 3.9 | 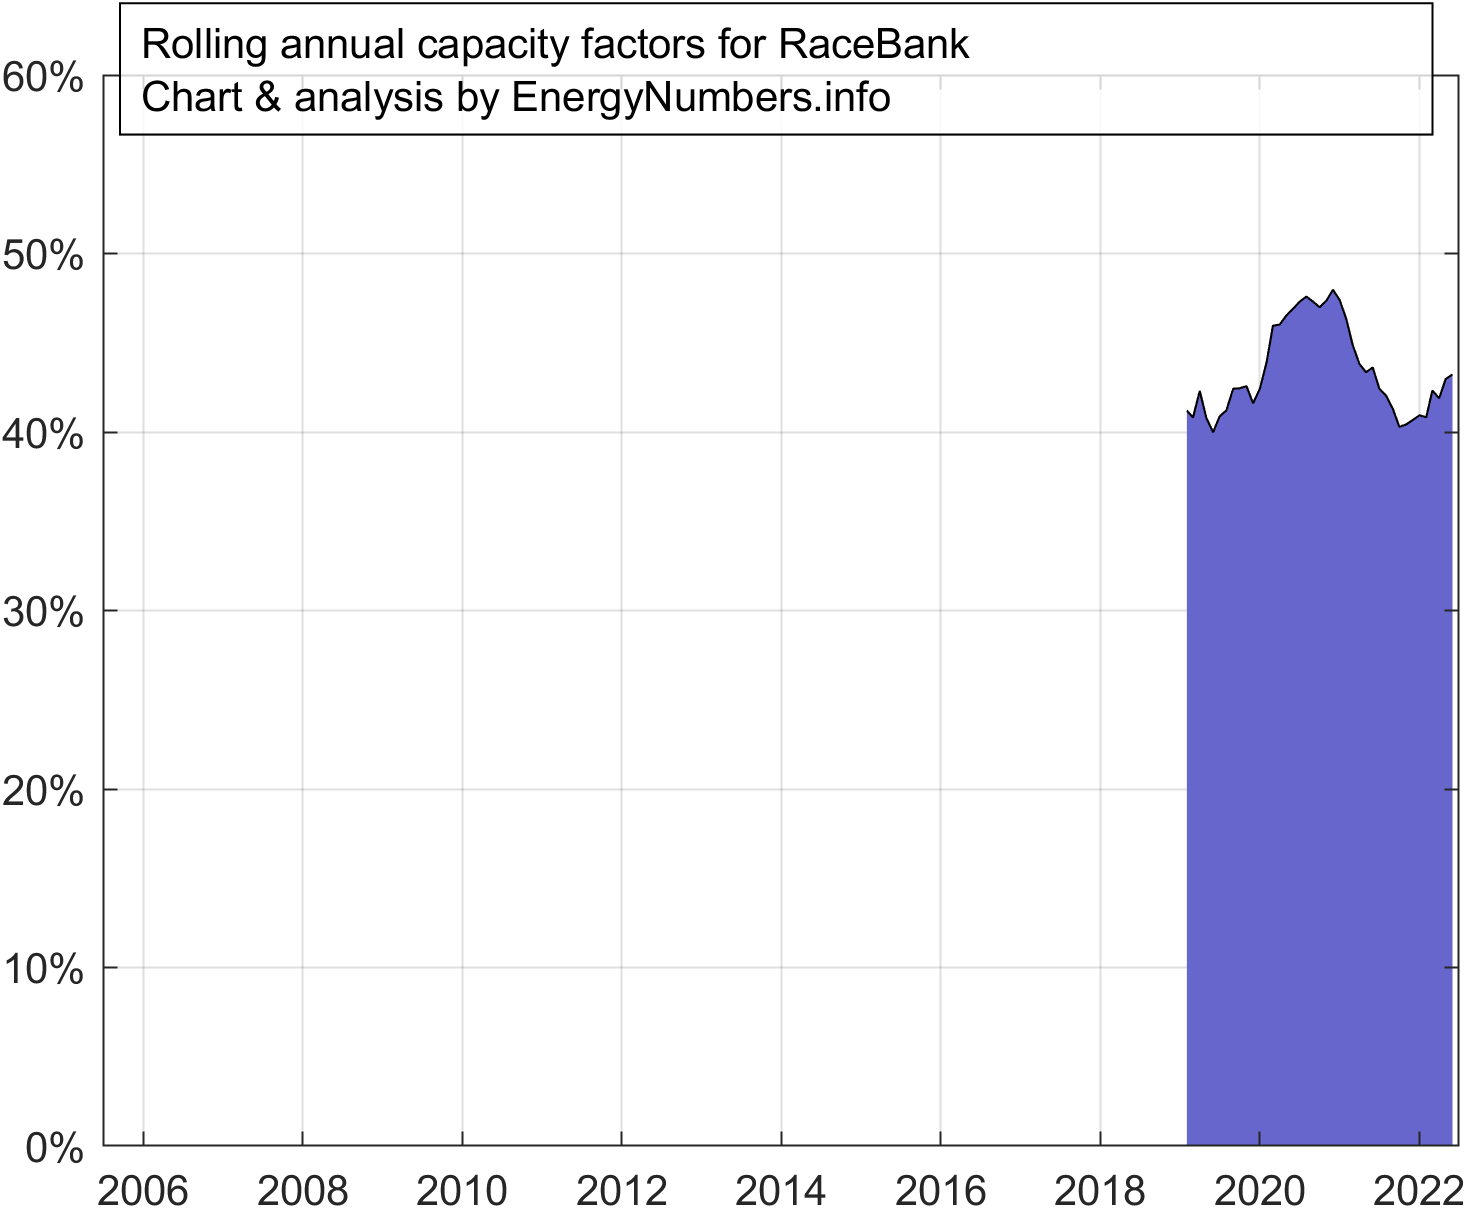 |
| Rampion | 46.7% | 39.2% | 8.4 | 400 | 11,575 | 2.2 |  |
| Robin Rigg | 38.1% | 35.5% | 16.0 | 174 | 8,653 | 3.4 | 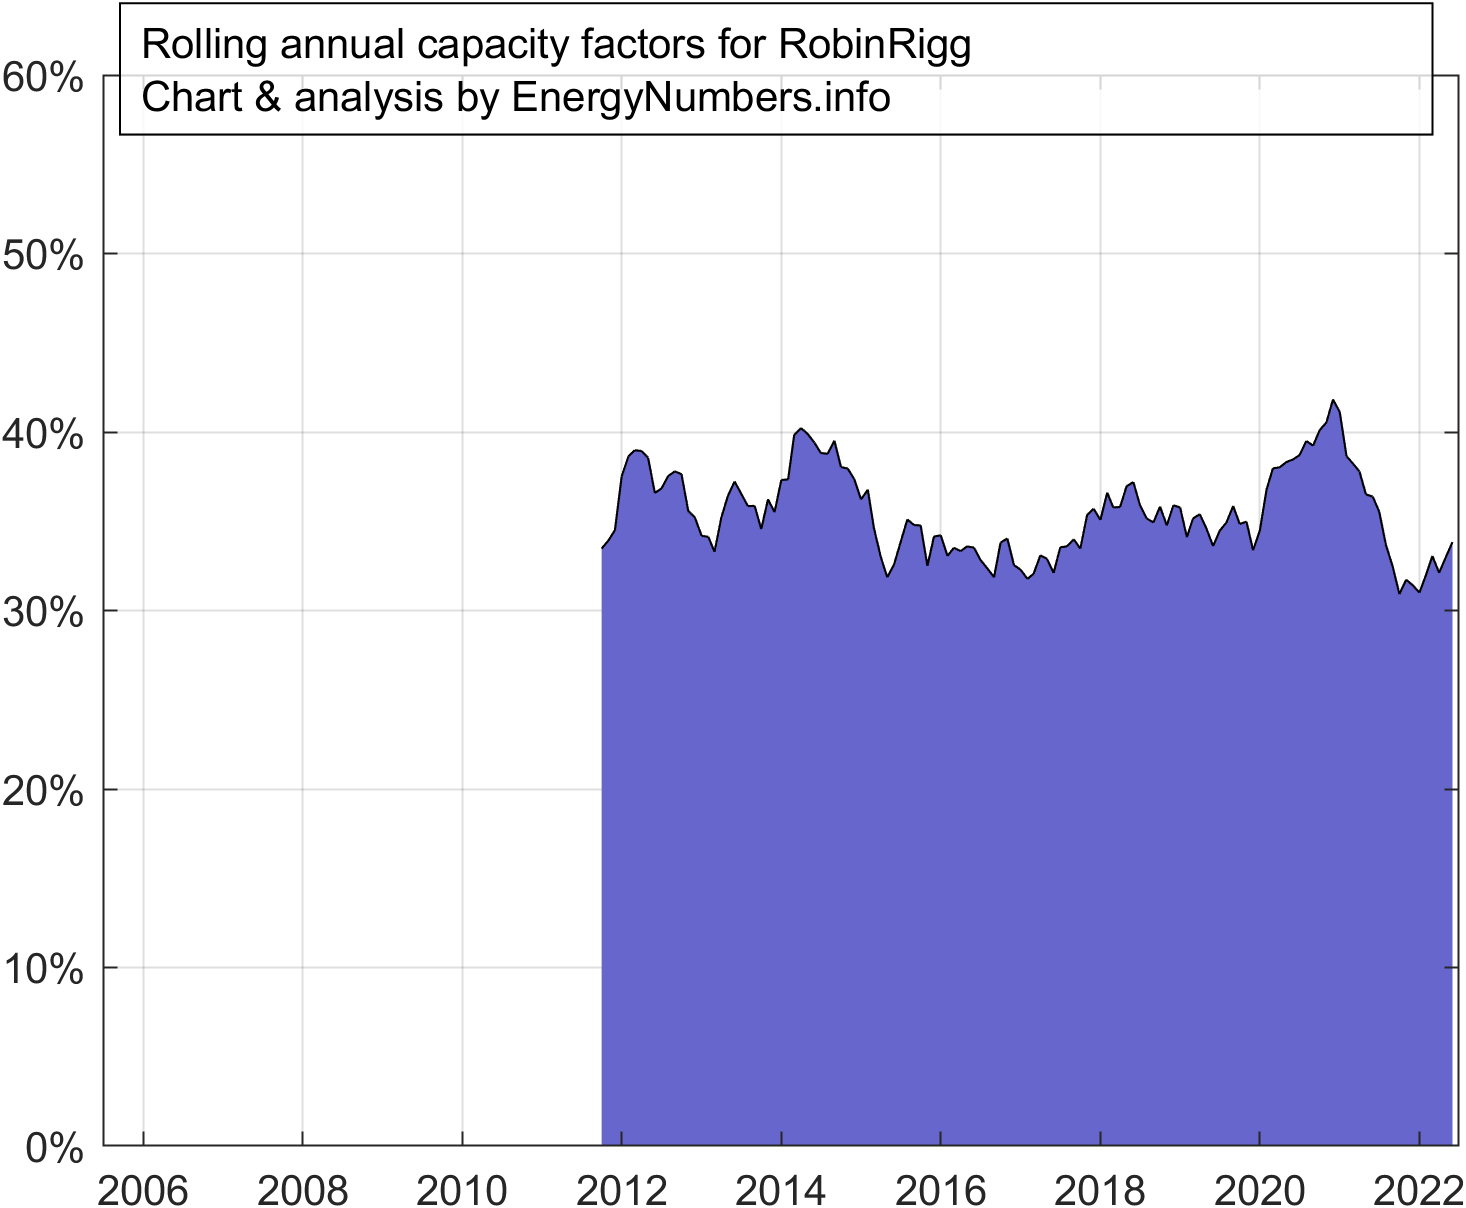 |
| Sheringham Shoal | 38.3% | 38.5% | 13.0 | 317 | 13,894 | 3.5 | 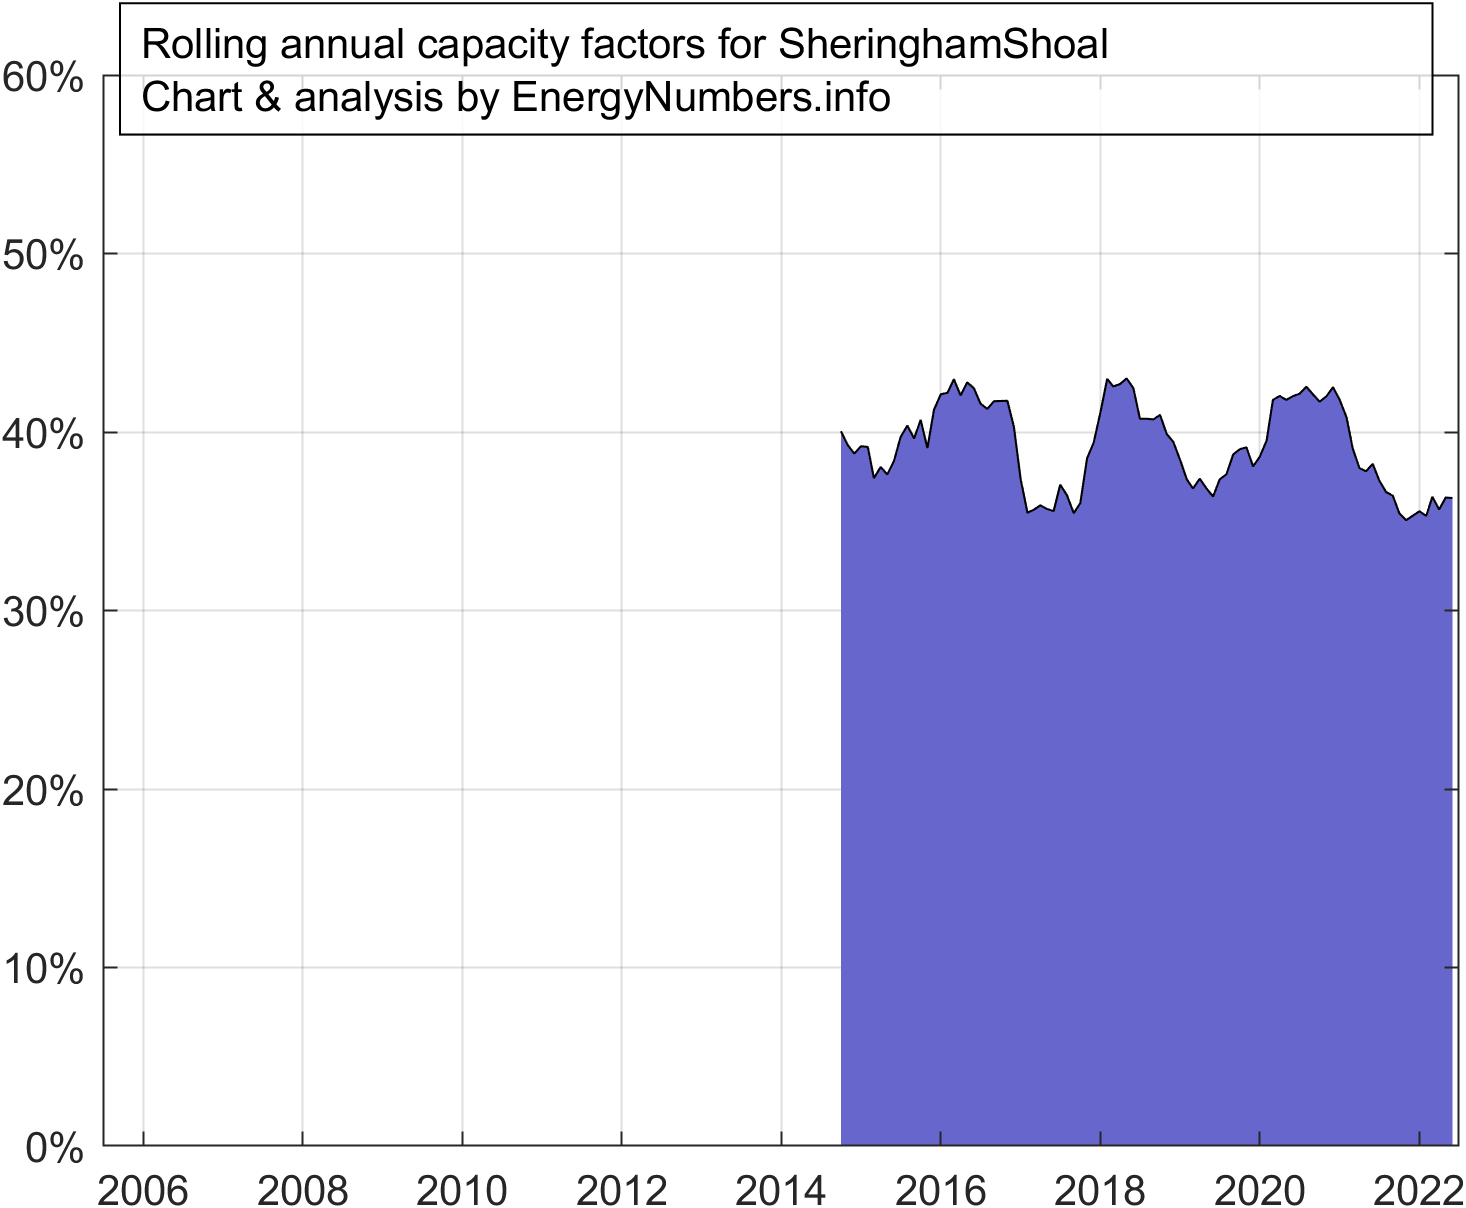 |
| Thanet | 32.3% | 33.1% | 15.9 | 300 | 13,914 | 2.8 |  |
| Triton Knoll | 41.8% | 37.8% | 4.5 | 857 | 12,773 | 2.2 |  |
| Walney phase 1 | 41.2% | 38.9% | 15.1 | 184 | 9,488 | 2.5 | 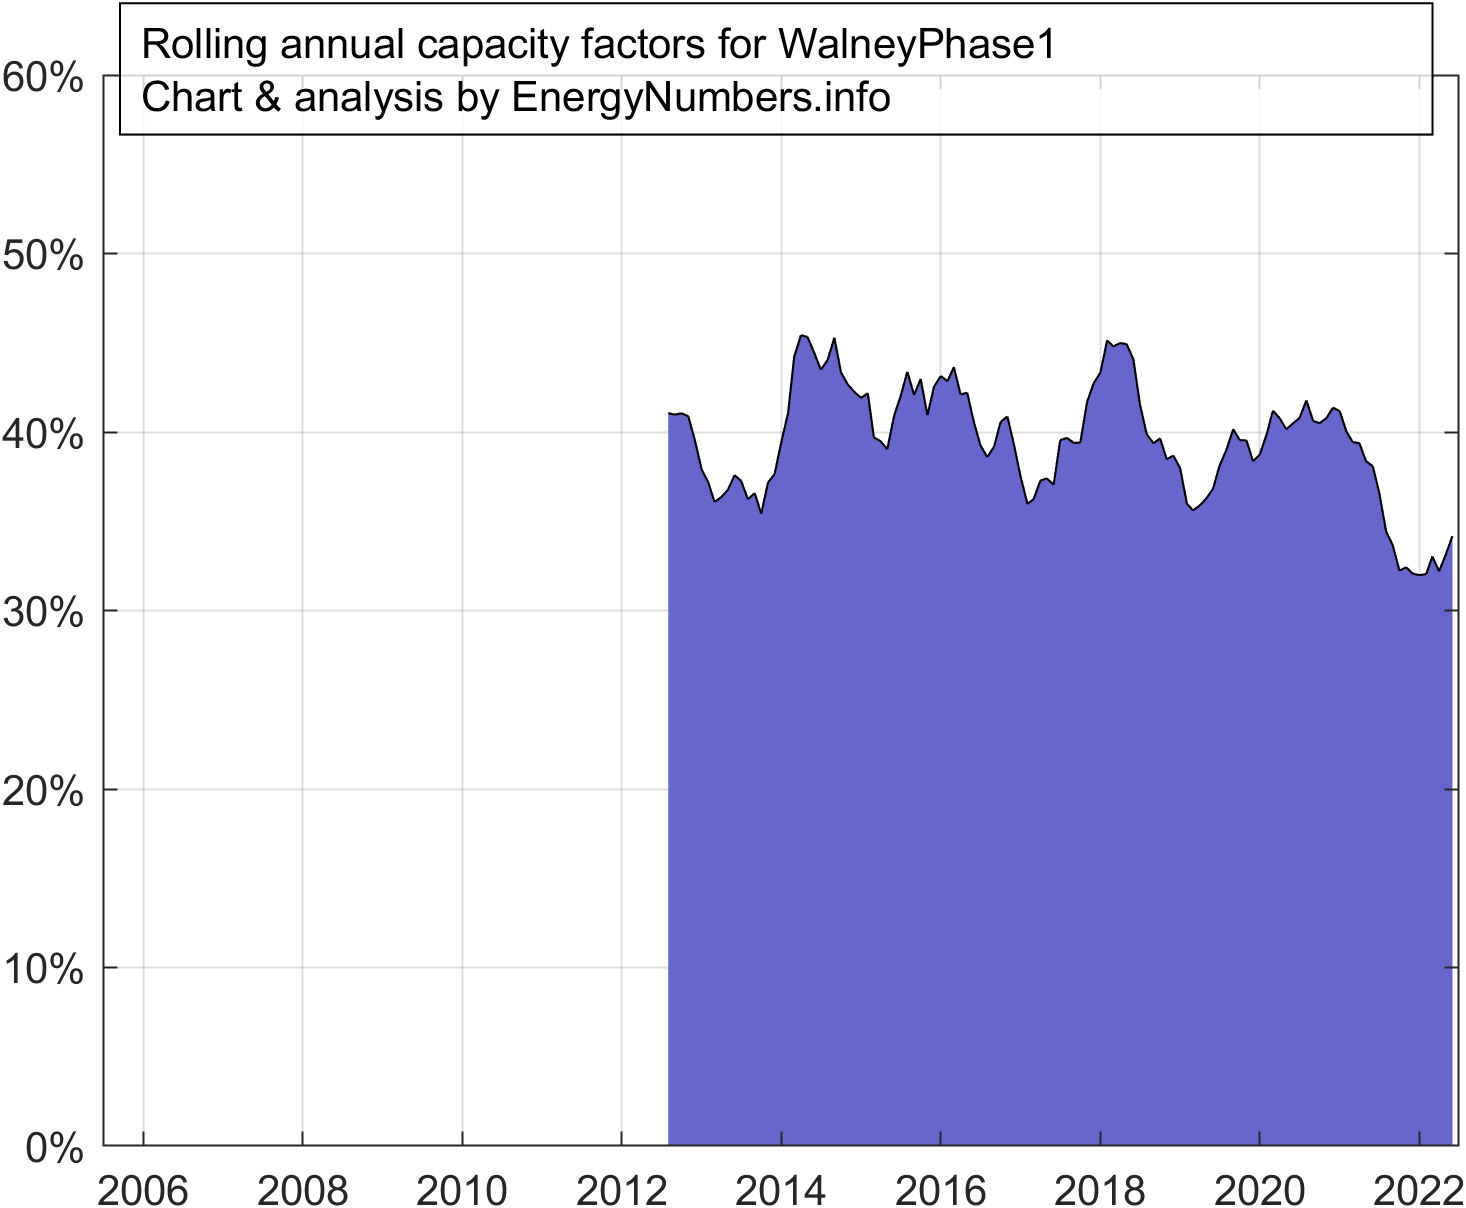 |
| Walney phase 2 | 46.5% | 44.3% | 14.2 | 184 | 10,156 | 1.8 | 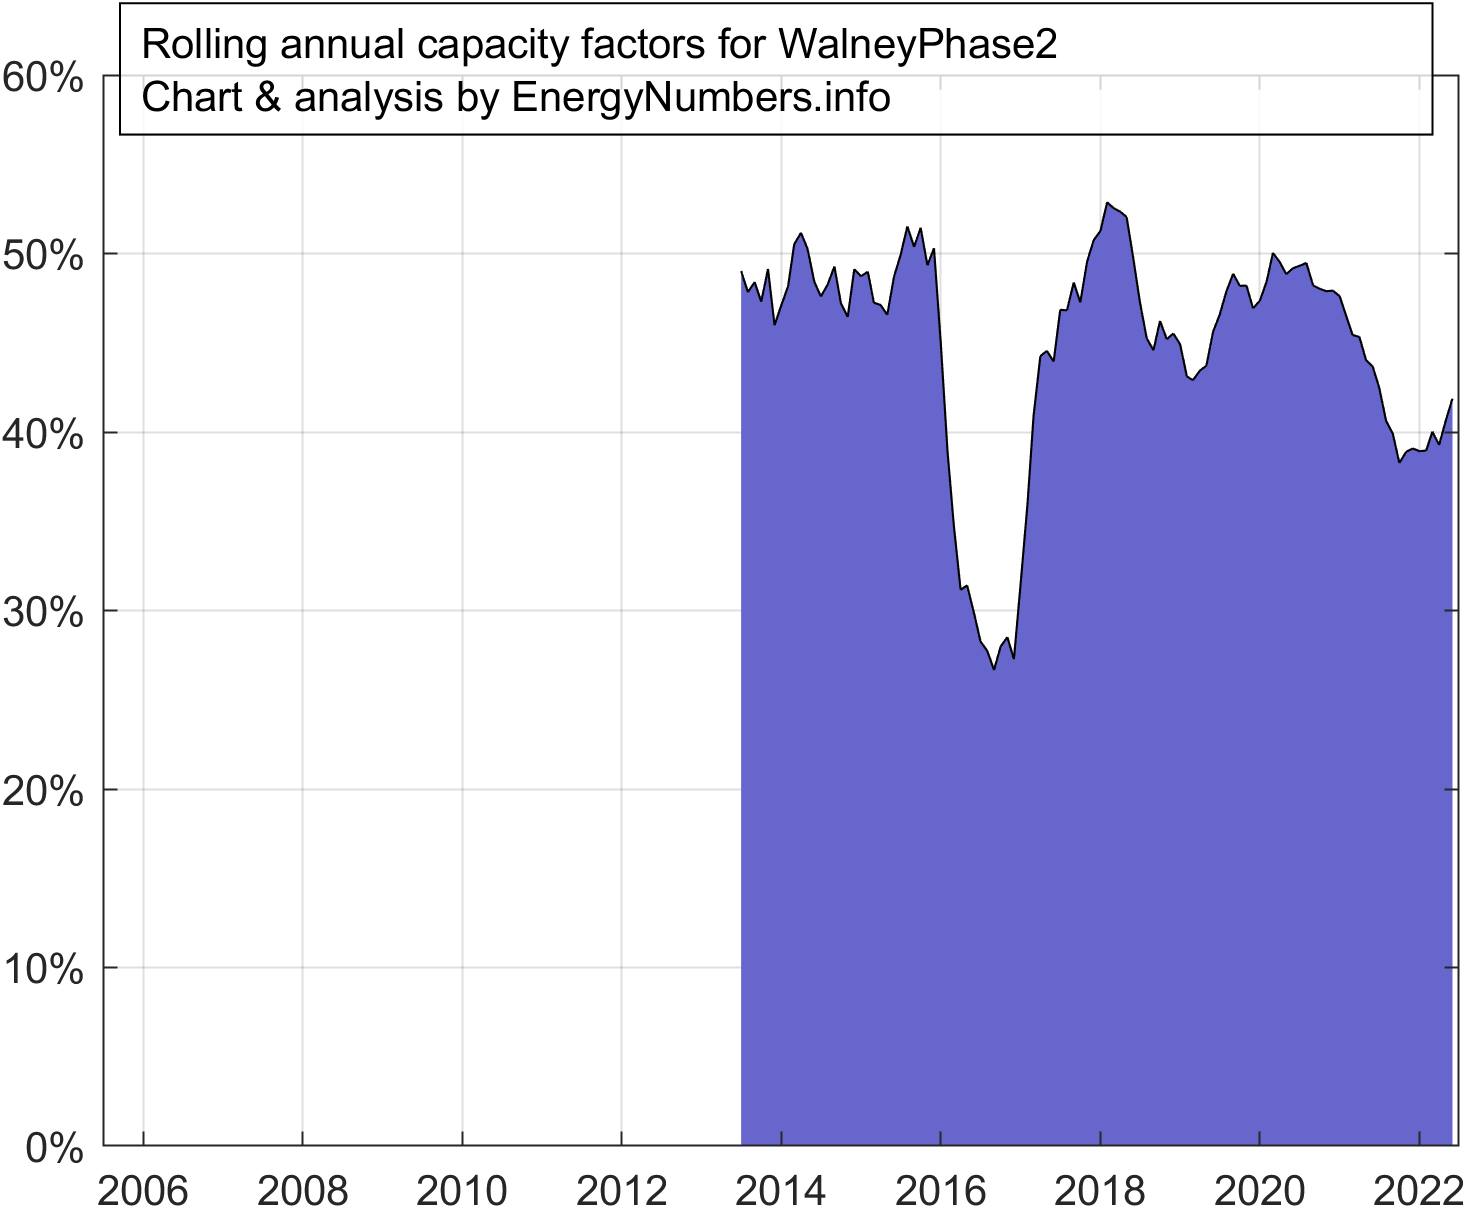 |
| Walney 3 & 4 | 47.4% | 45.4% | 8.0 | 659 | 20,970 | 2.0 | 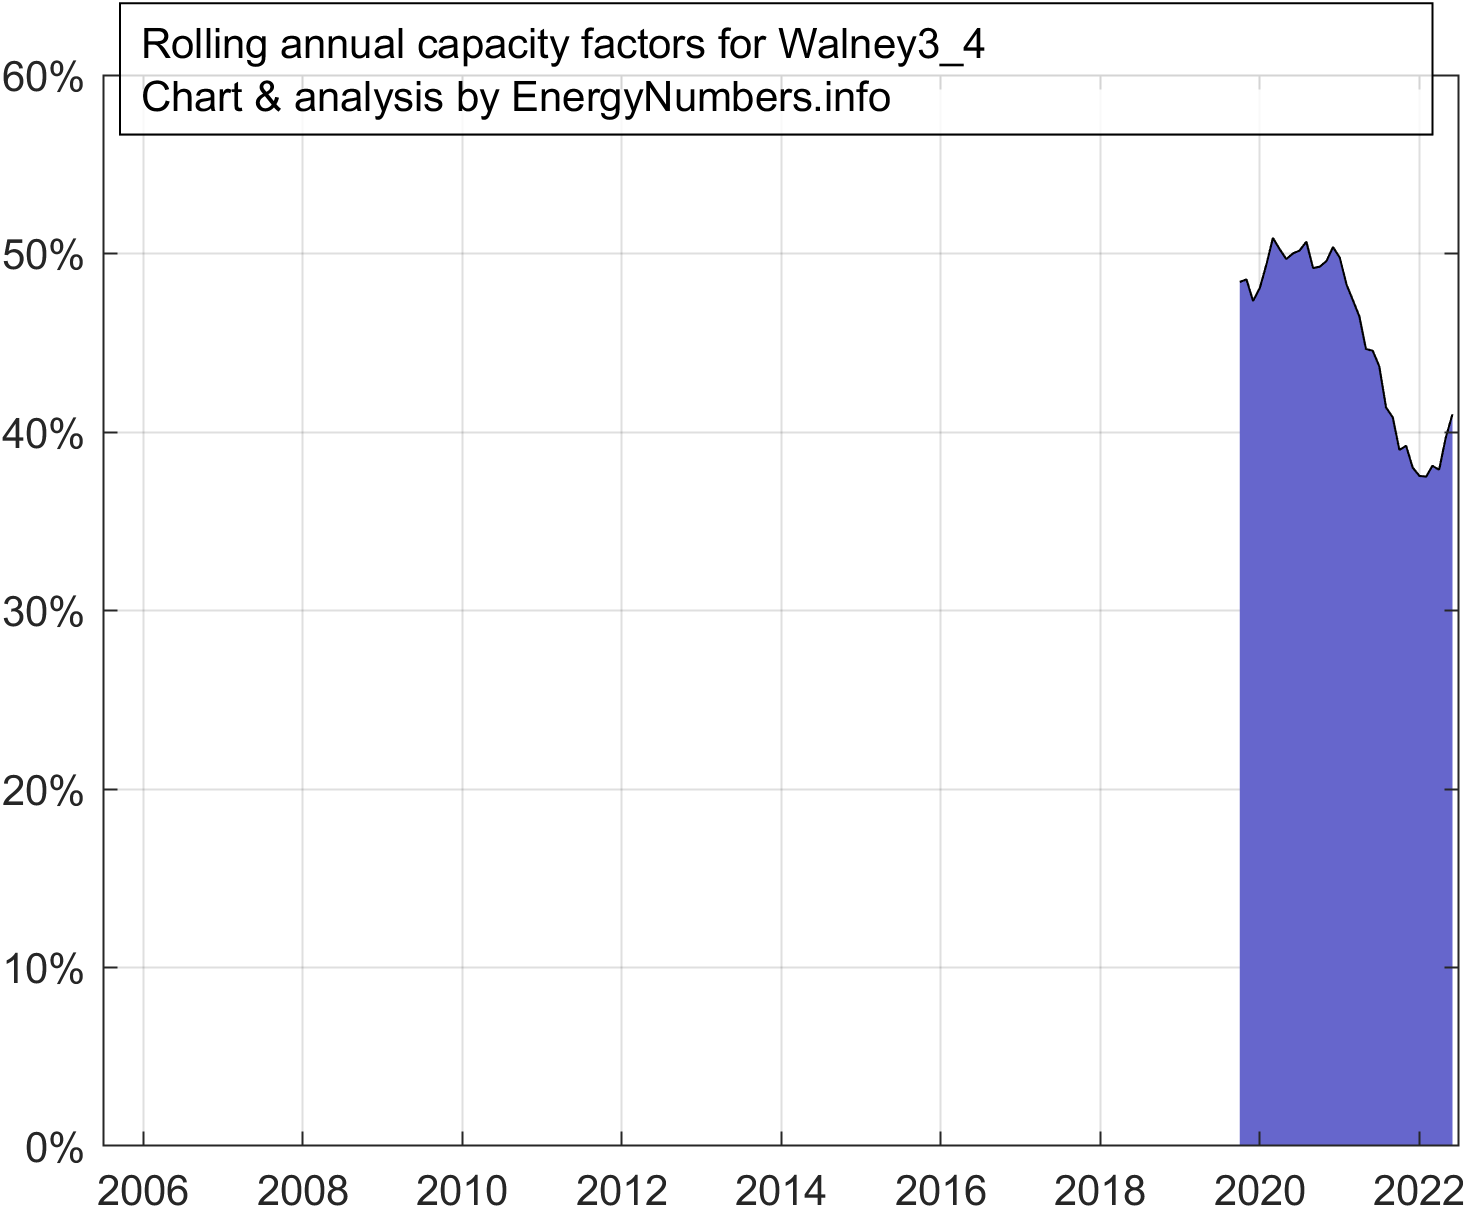 |
| Westermost Rough | 49.8% | 46.2% | 11.3 | 210 | 9,635 | 2.8 | 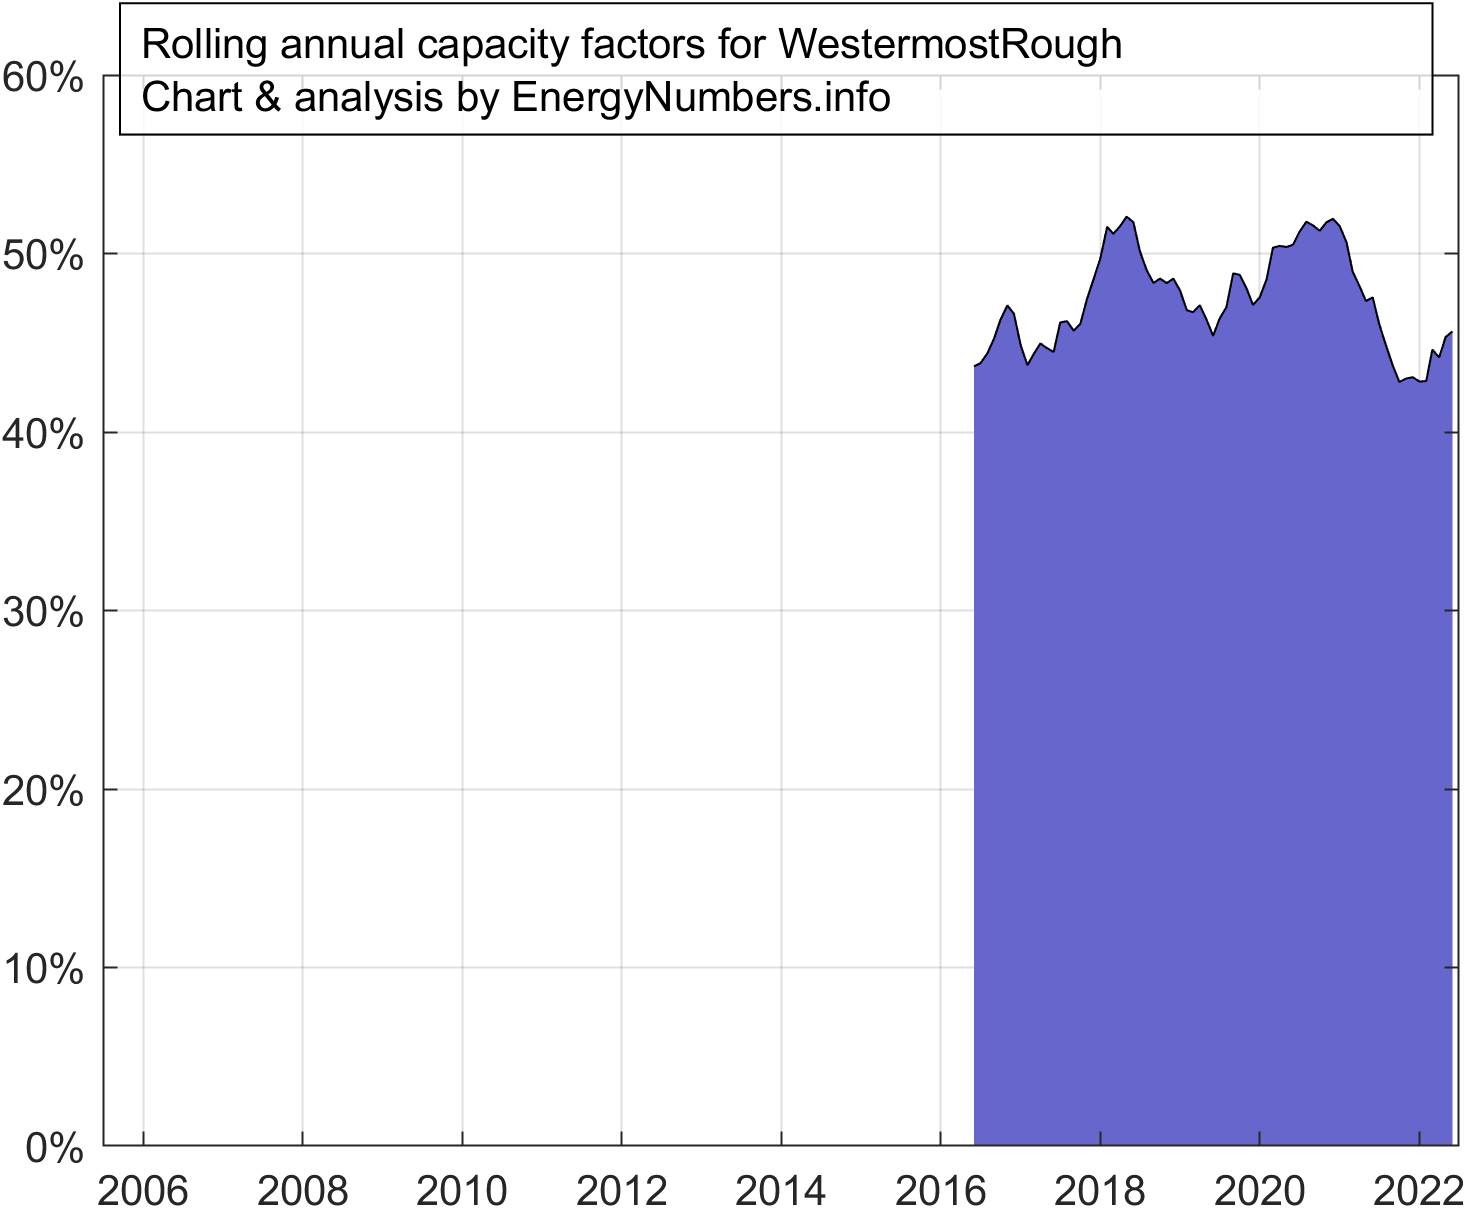 |
| West of Duddon Sands | 44.6% | 44.1% | 11.8 | 389 | 17,909 | 2.6 |  |
| Beatrice Demo | 24.4% | 8.3 | 10 | 123 | 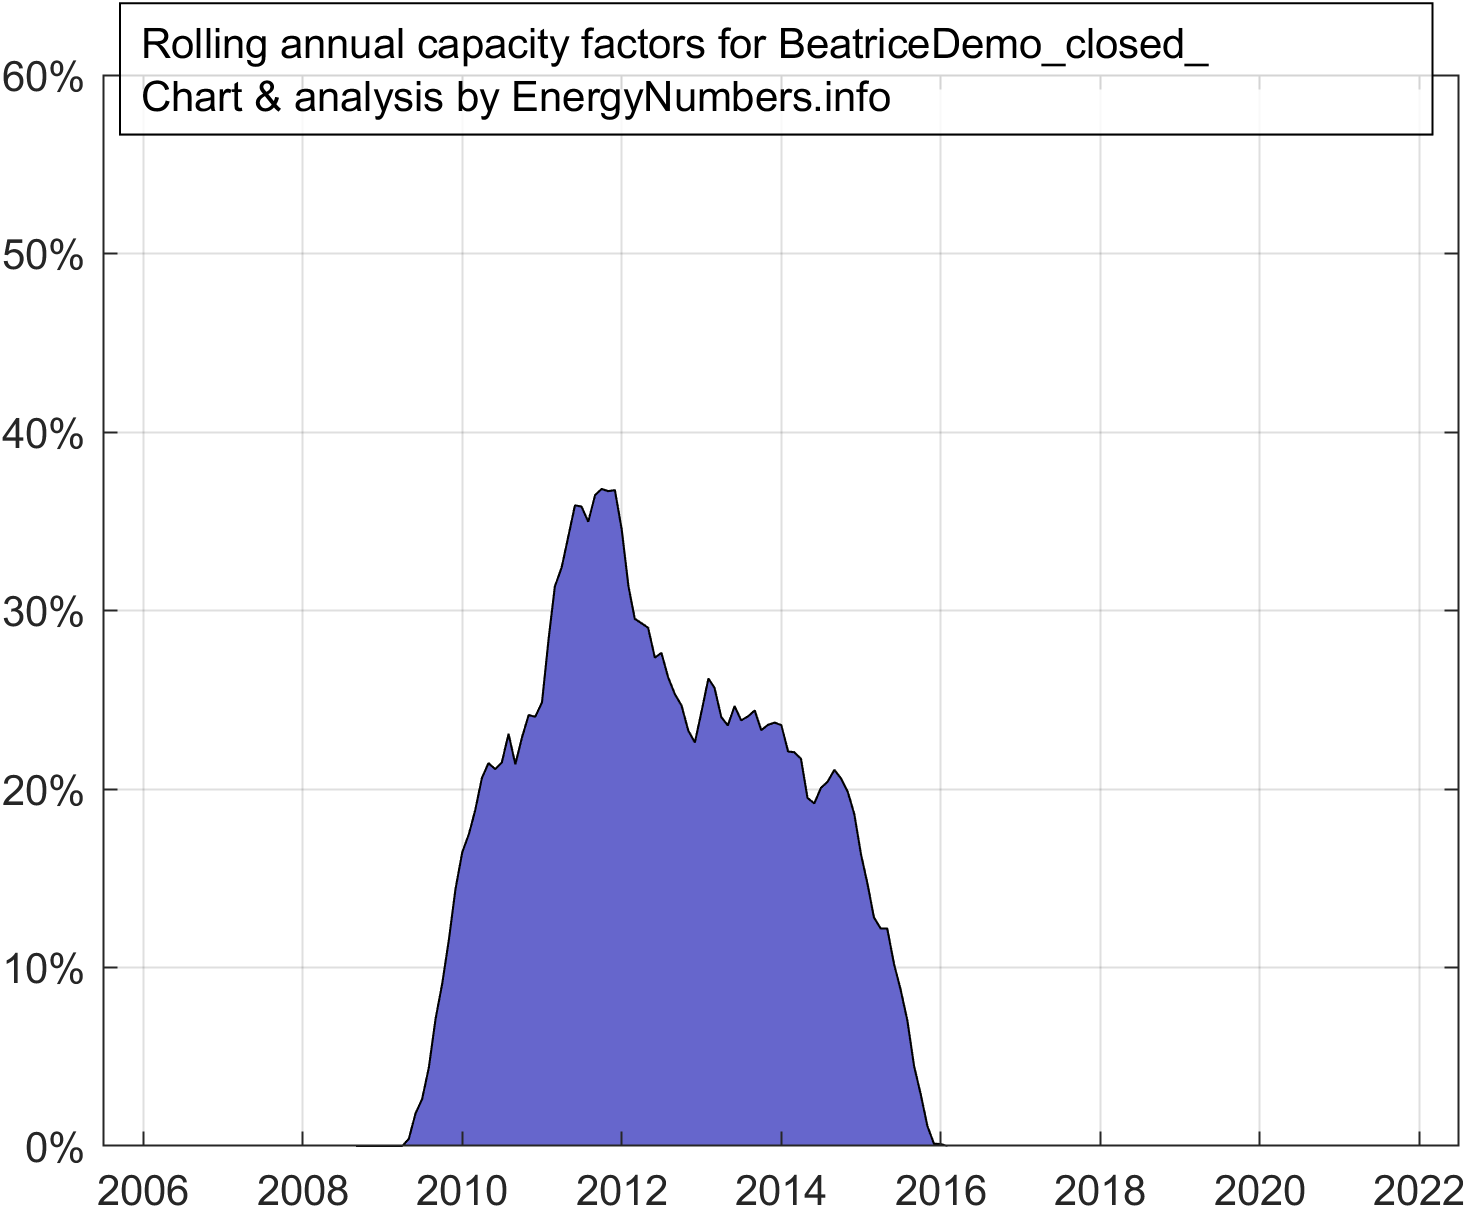 |
||
| Blyth Demo | 14.7% | 12.8 | 4 | 39 | 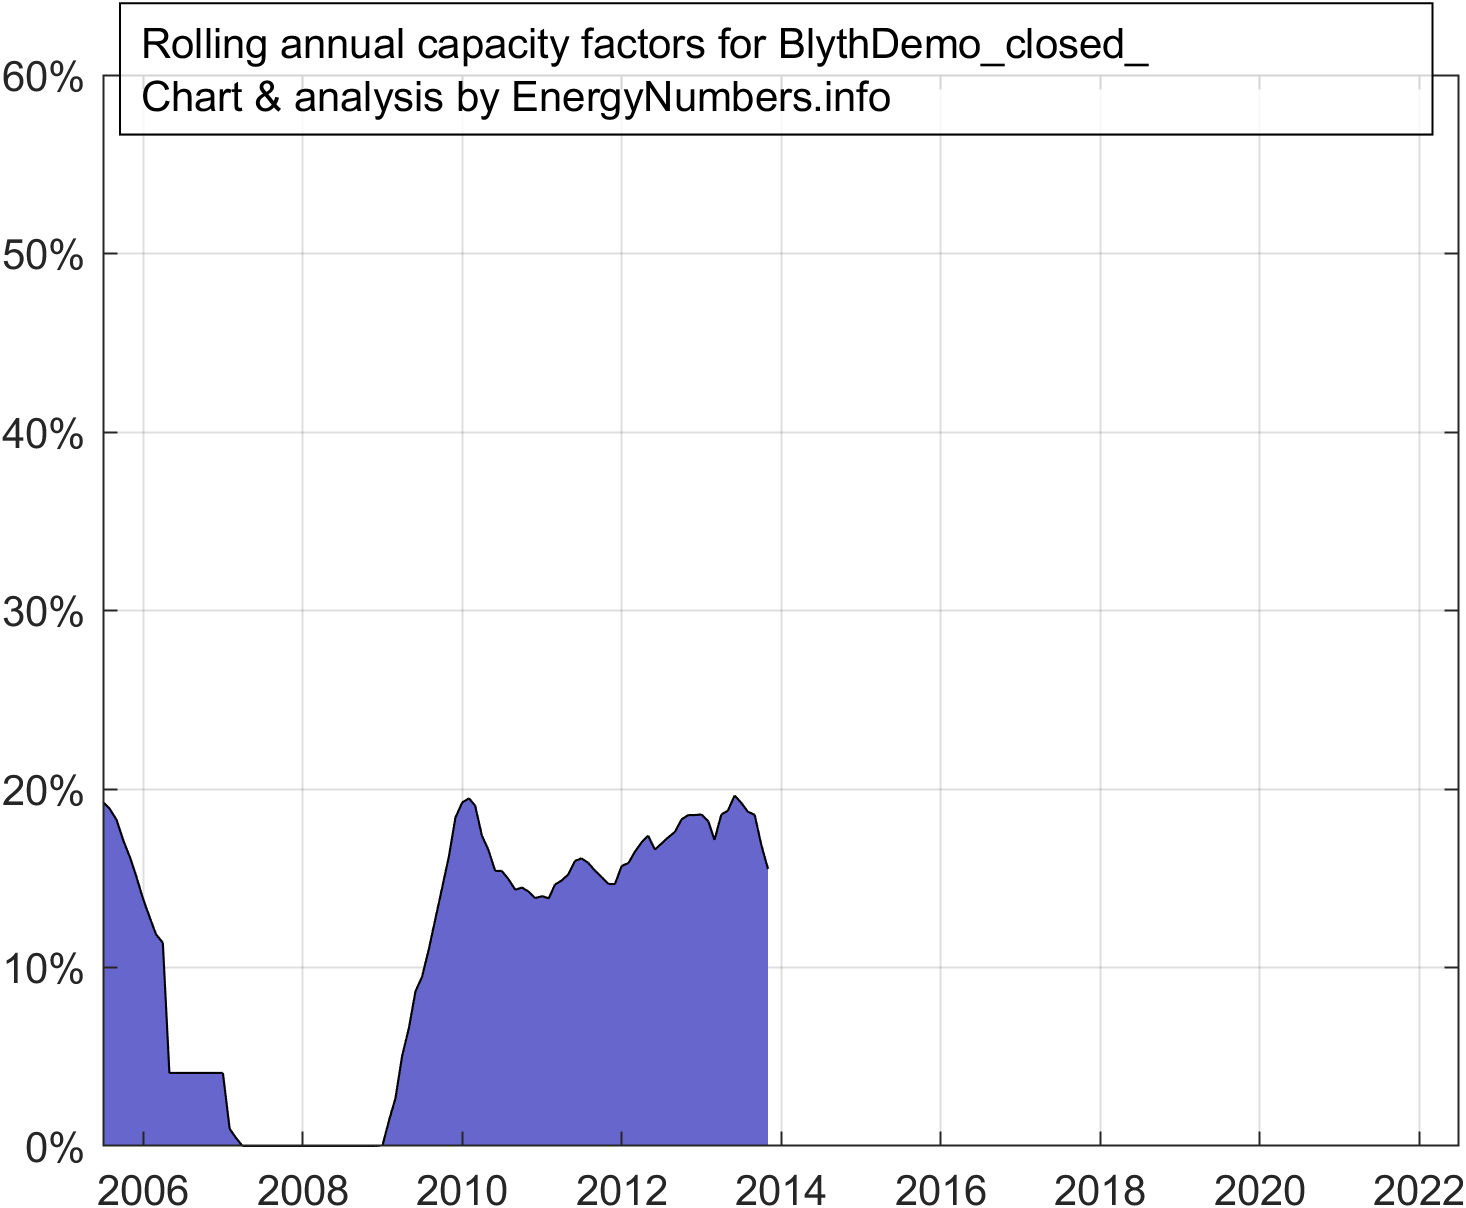 |
||
| Blyth Demo Array 2 | 41.3% | 8.2 | 42 | 1,214 |  |
||
| Fife Demo | 19.5% | 12.5 | 7 | 133 | 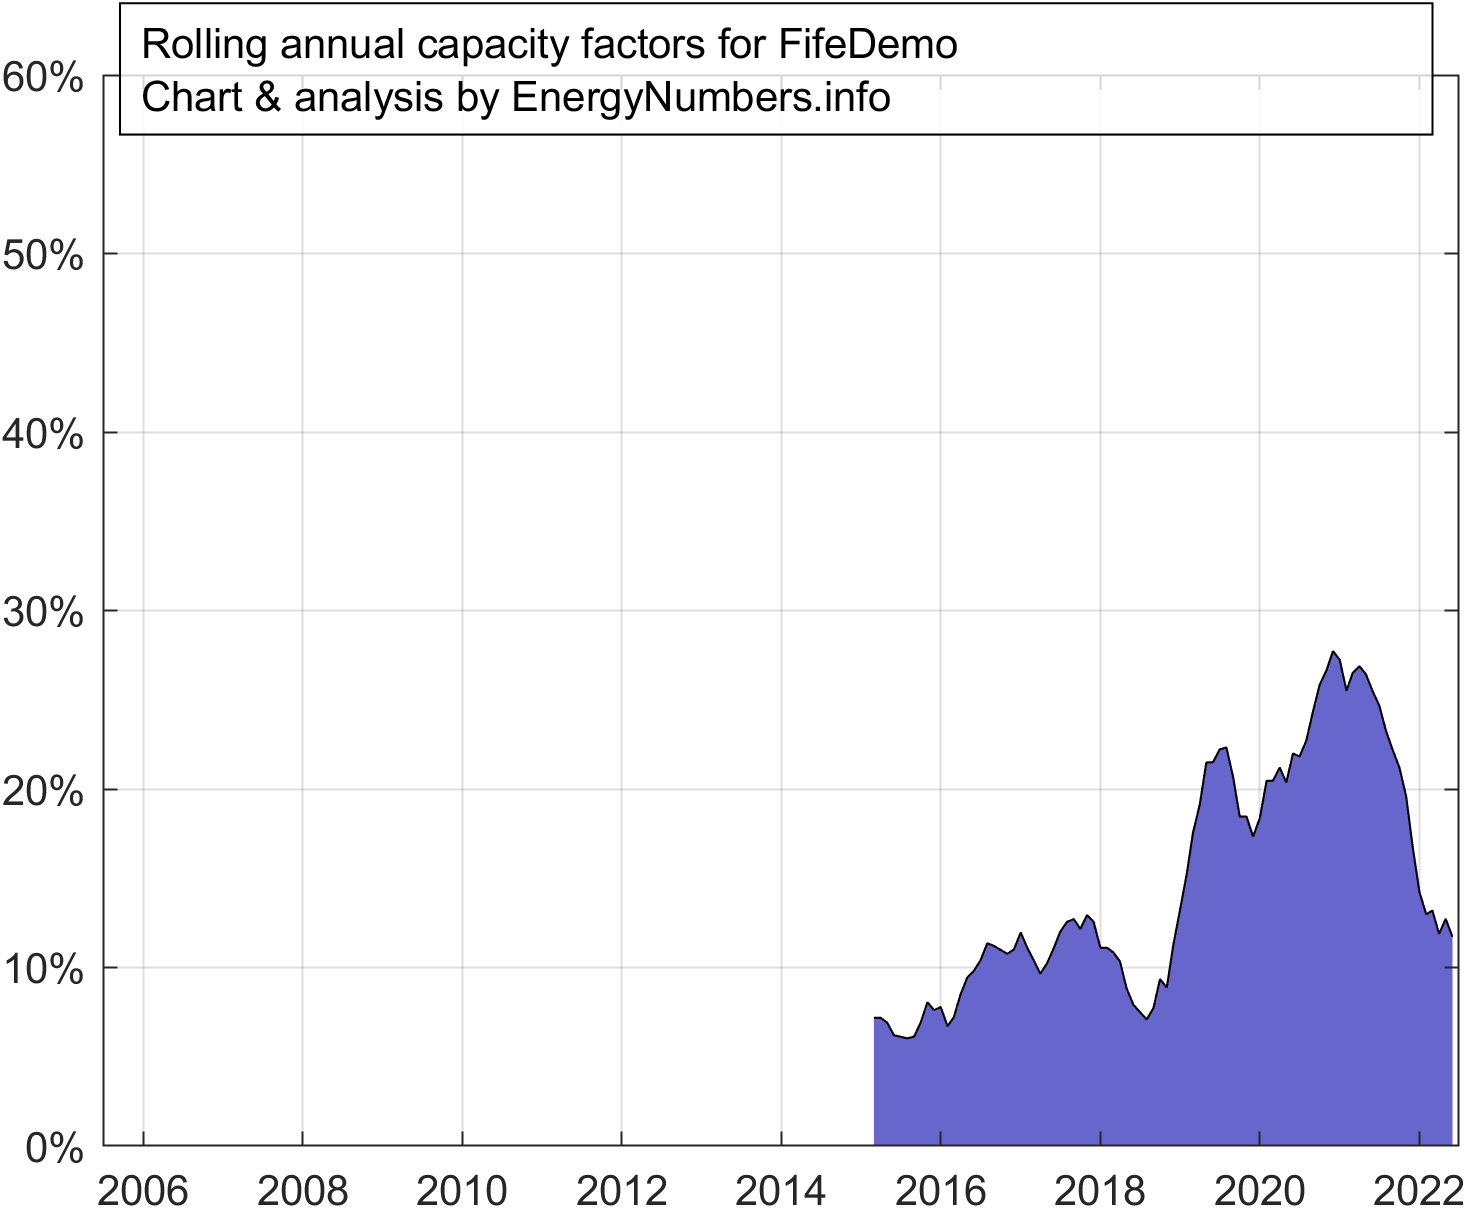 |
||
| Gunfleet Sands Demo | 30.1% | 13.0 | 12 | 402 | 1.4 | 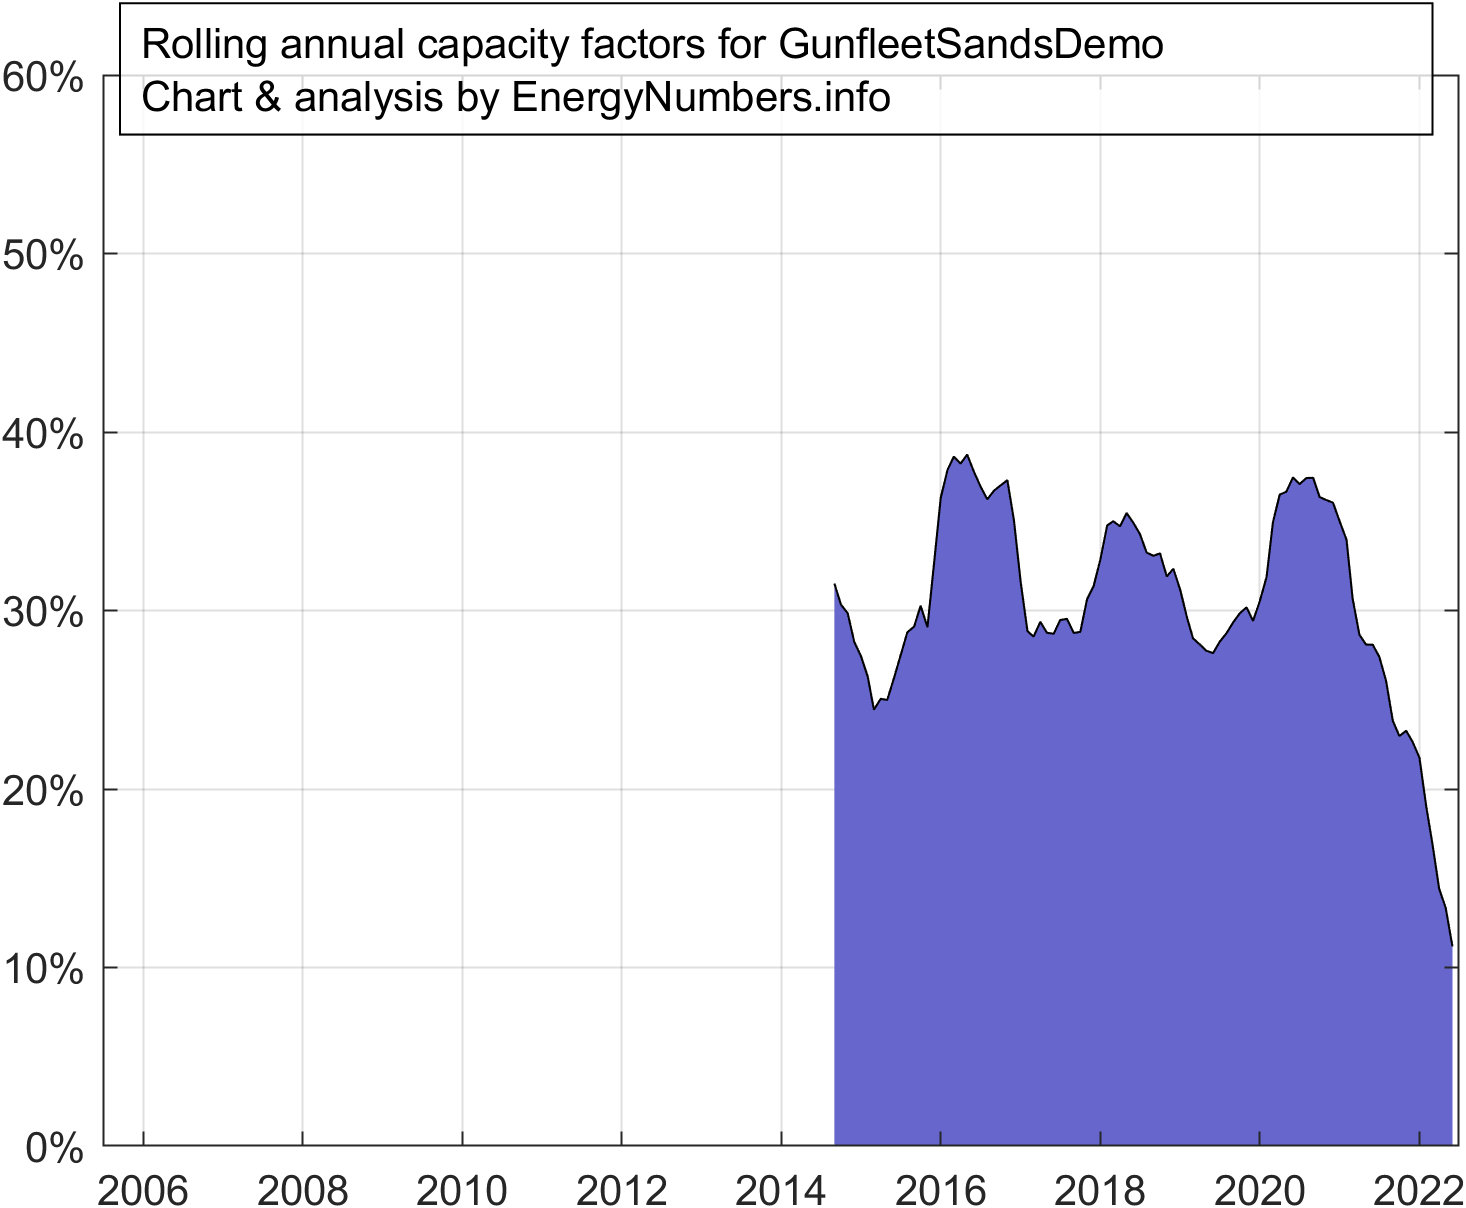 |
|
| Inner Dowsing | 35.3% | 17.4 | 97 | 5,209 | 3.9 | 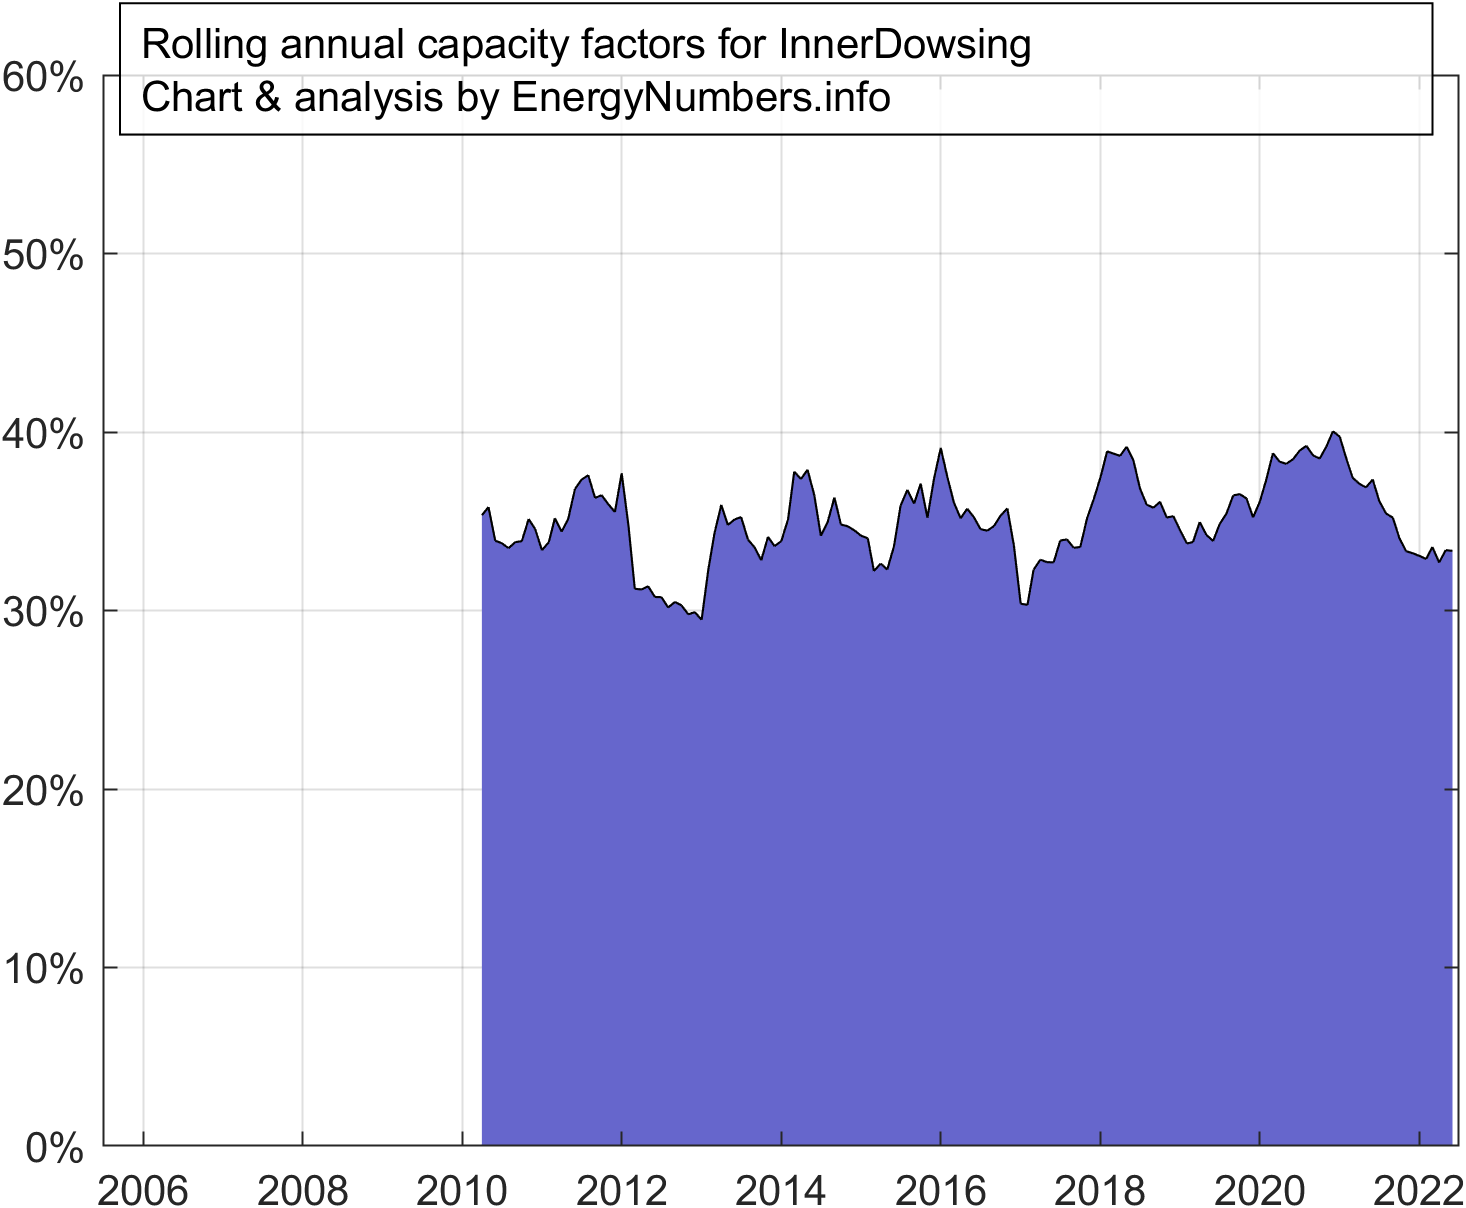 |
|
| Kentish Flats | 30.4% | 20.7 | 90 | 4,920 | 2.8 | 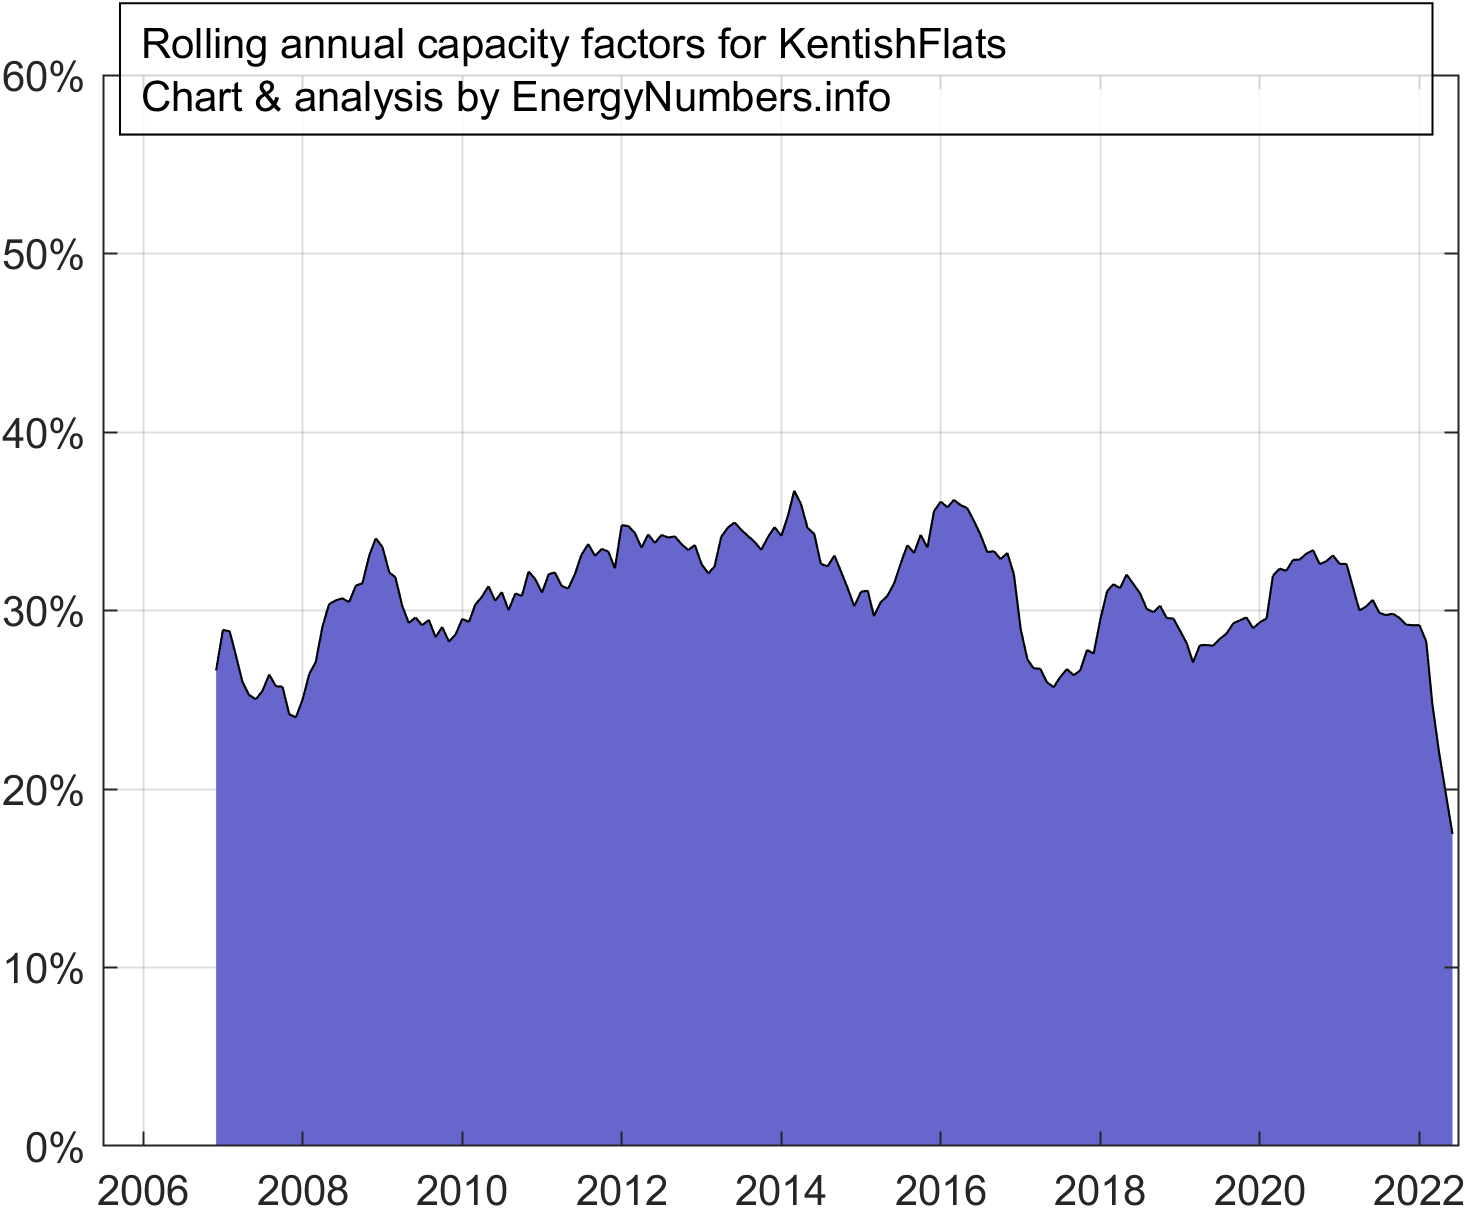 |
|
| Kentish Flats Extension | 41.4% | 10.7 | 50 | 1,900 | 2.5 | 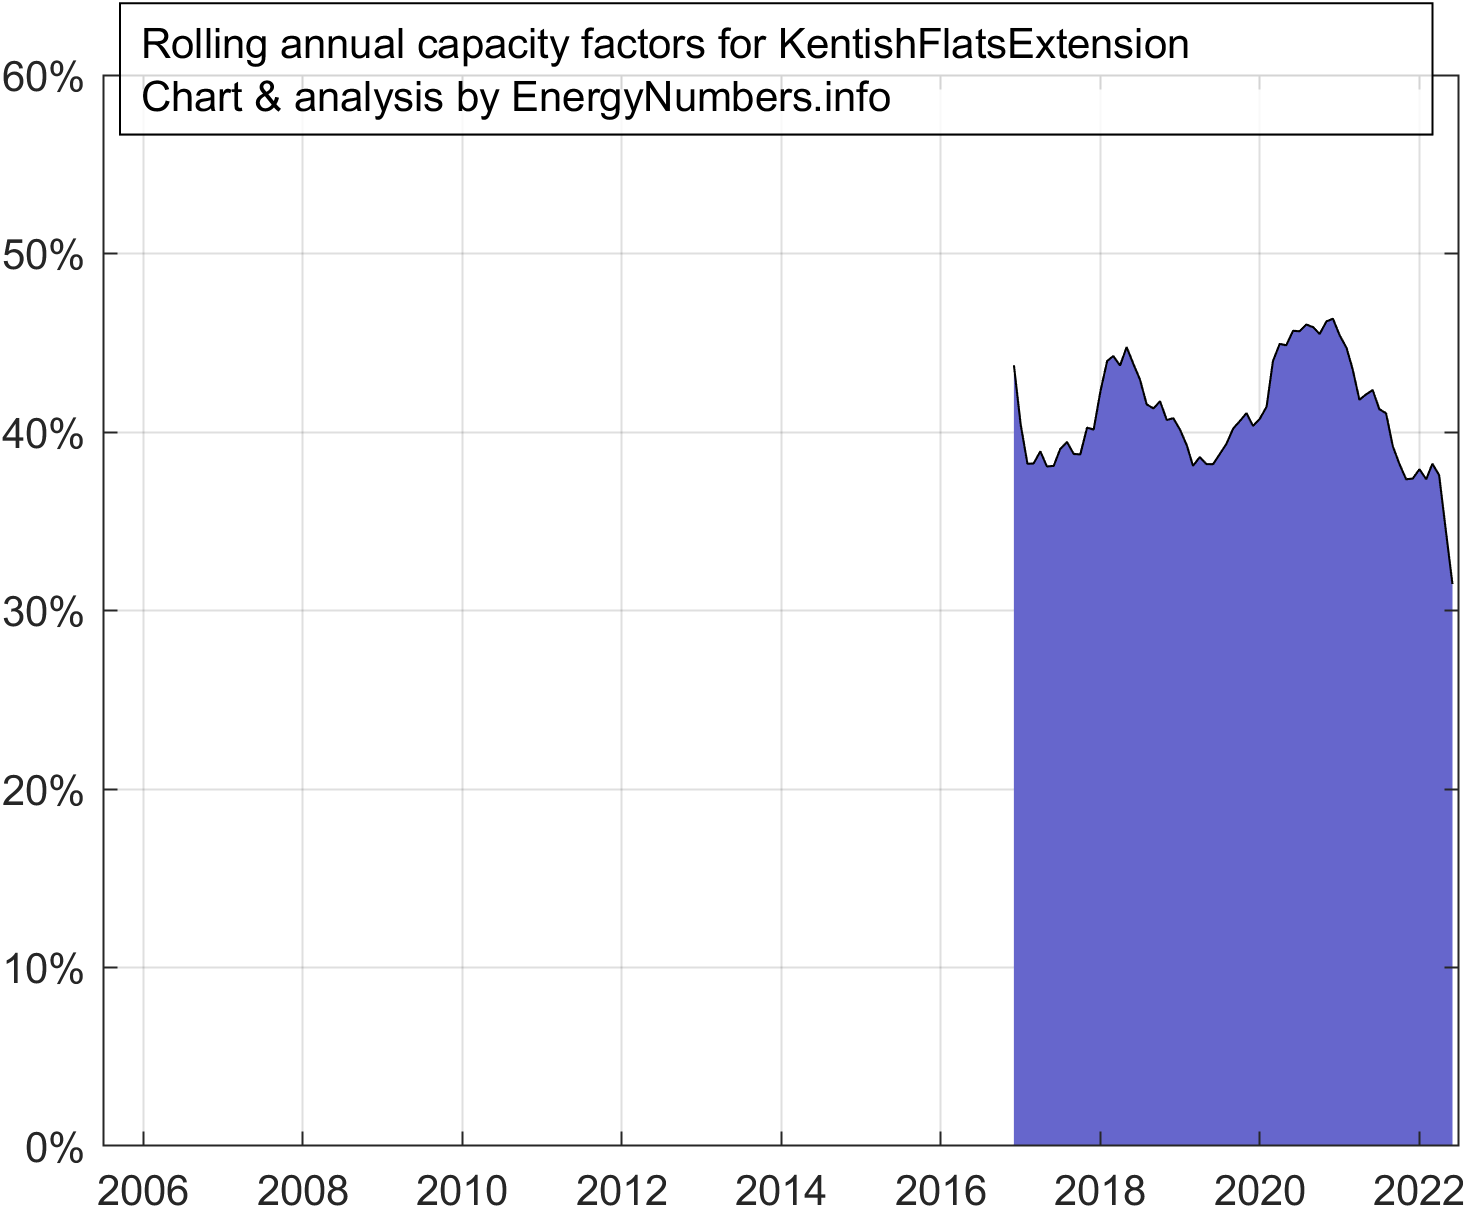 |
|
| Kincardine demo | 41.0% | 1.9 | 2 | 13 | 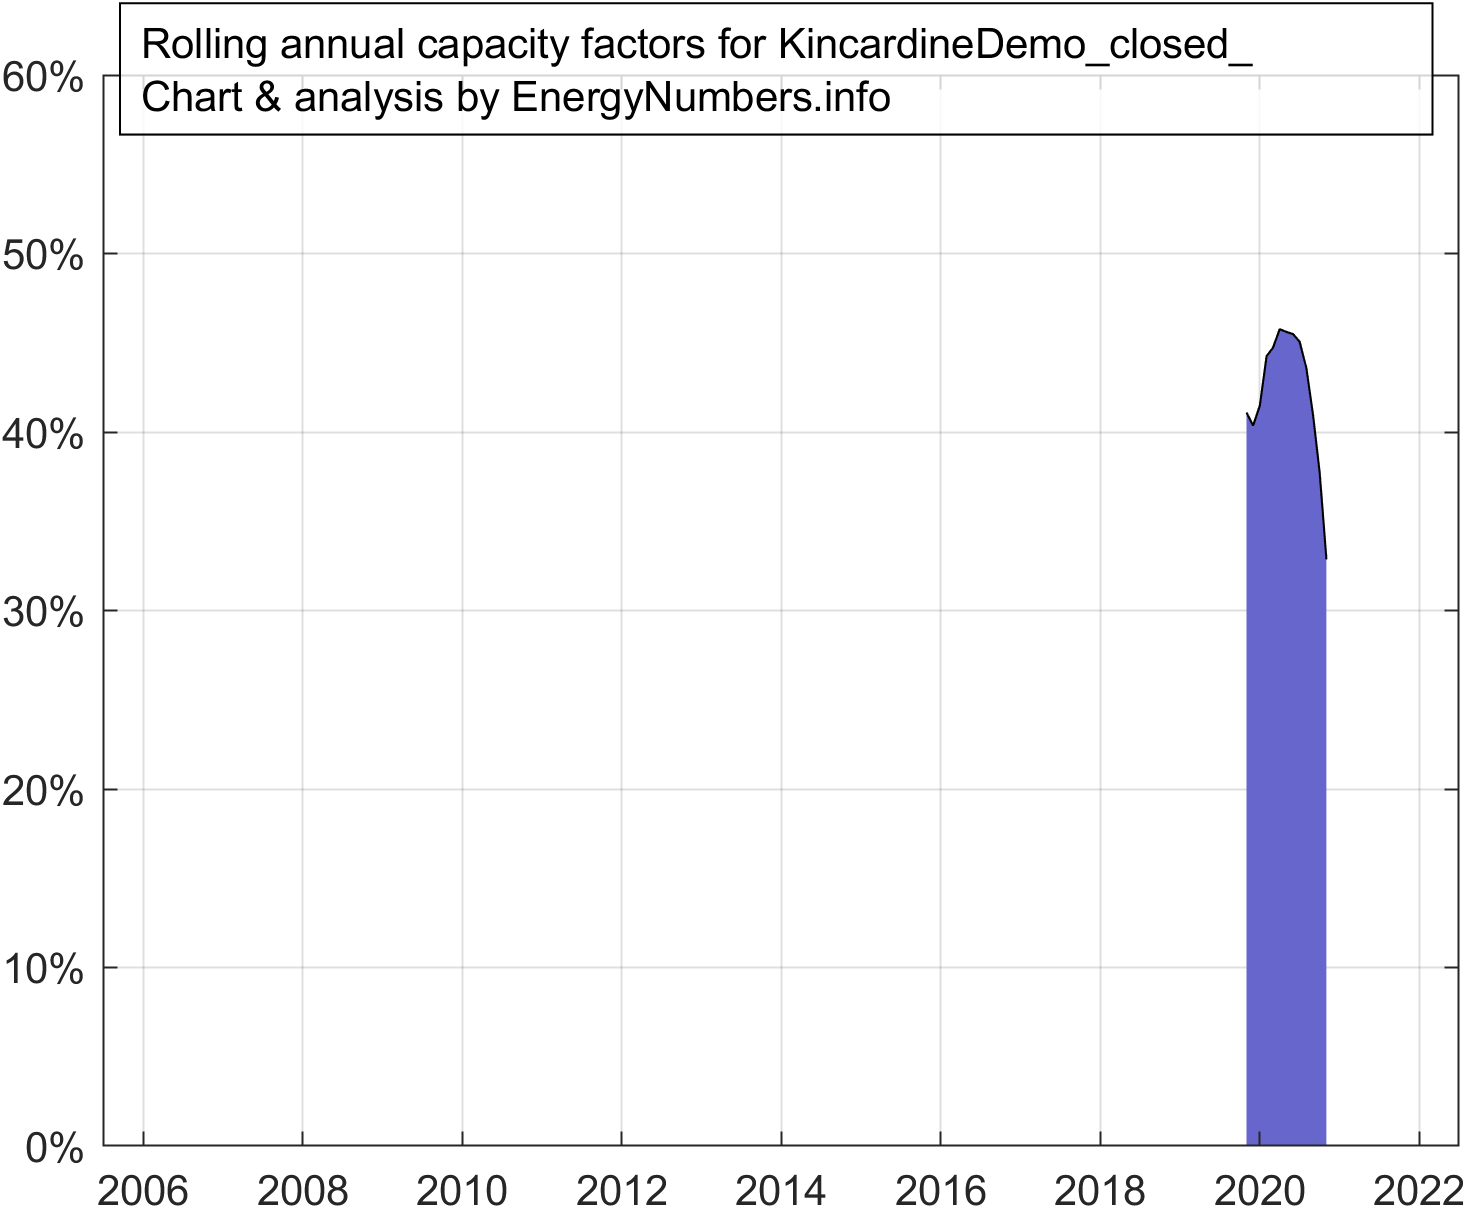 |
||
| Lynn | 34.7% | 17.4 | 97 | 5,155 | 4.3 |  |
|
| North Hoyle | 34.7% | 22.2 | 60 | 3,530 | 2.2 | 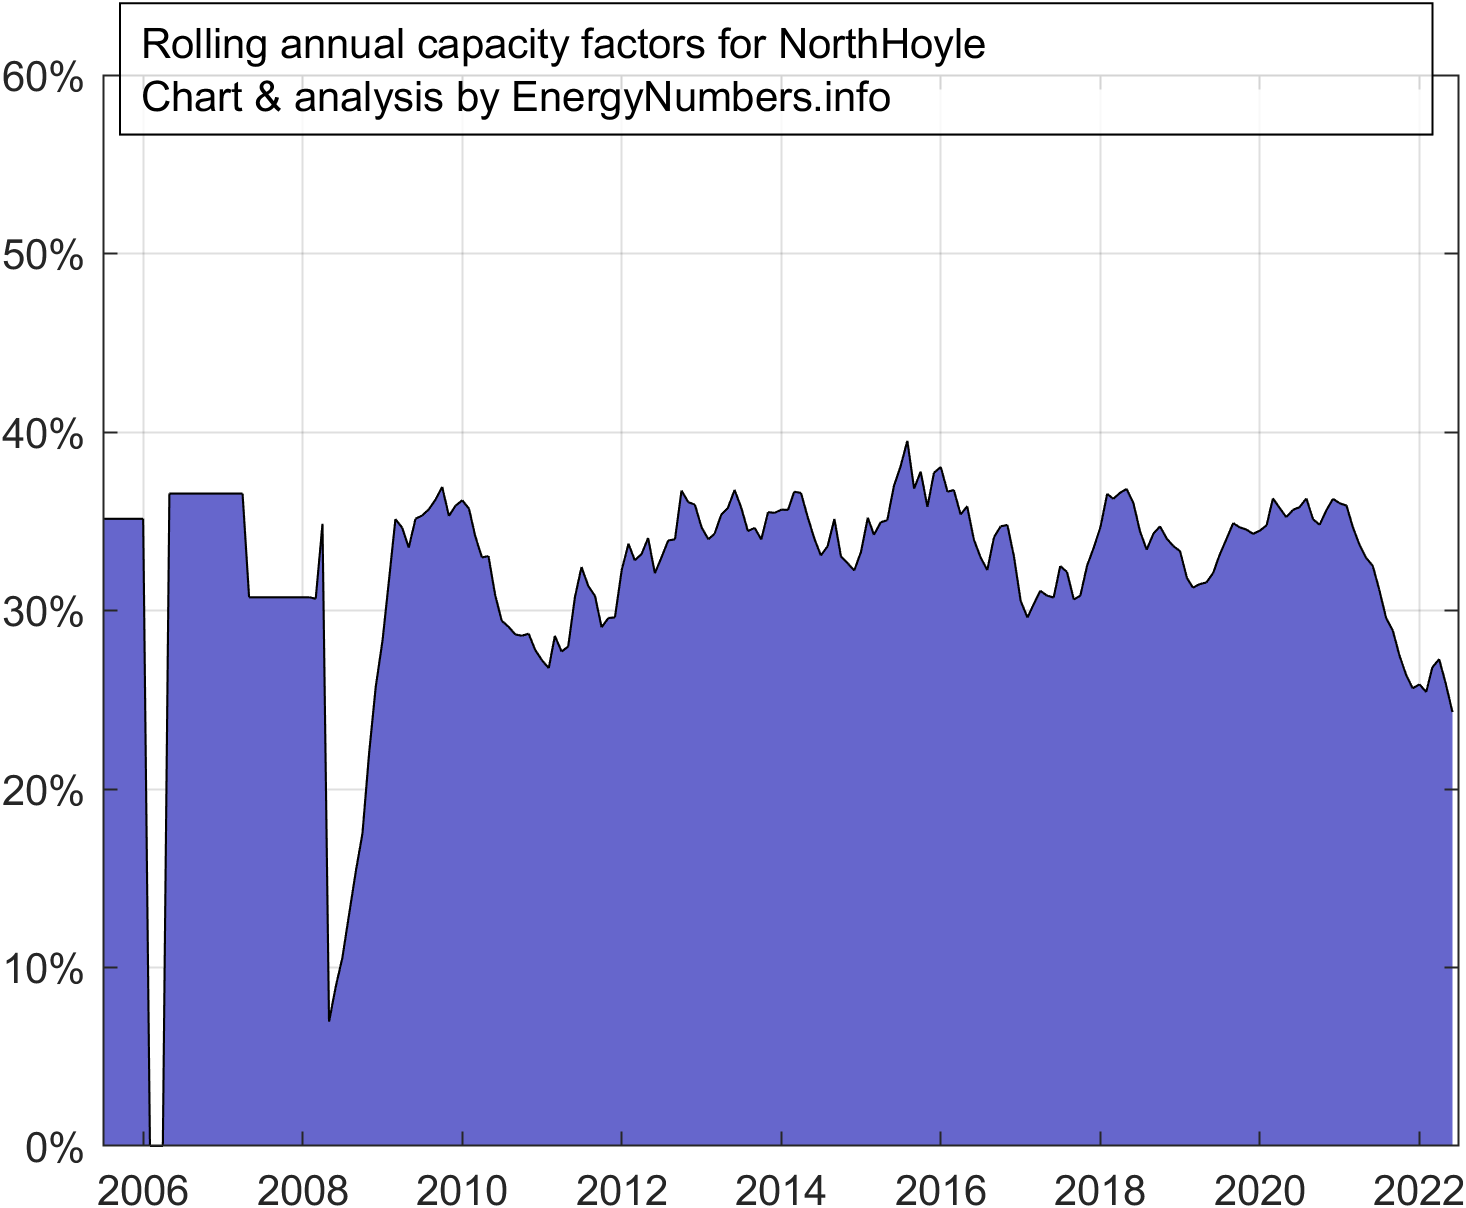 |
|
| Rhyl Flats | 34.7% | 16.7 | 90 | 4,443 | 3.2 |  |
|
| Scroby Sands | 31.2% | 21.7 | 60 | 3,533 | 4.4 | 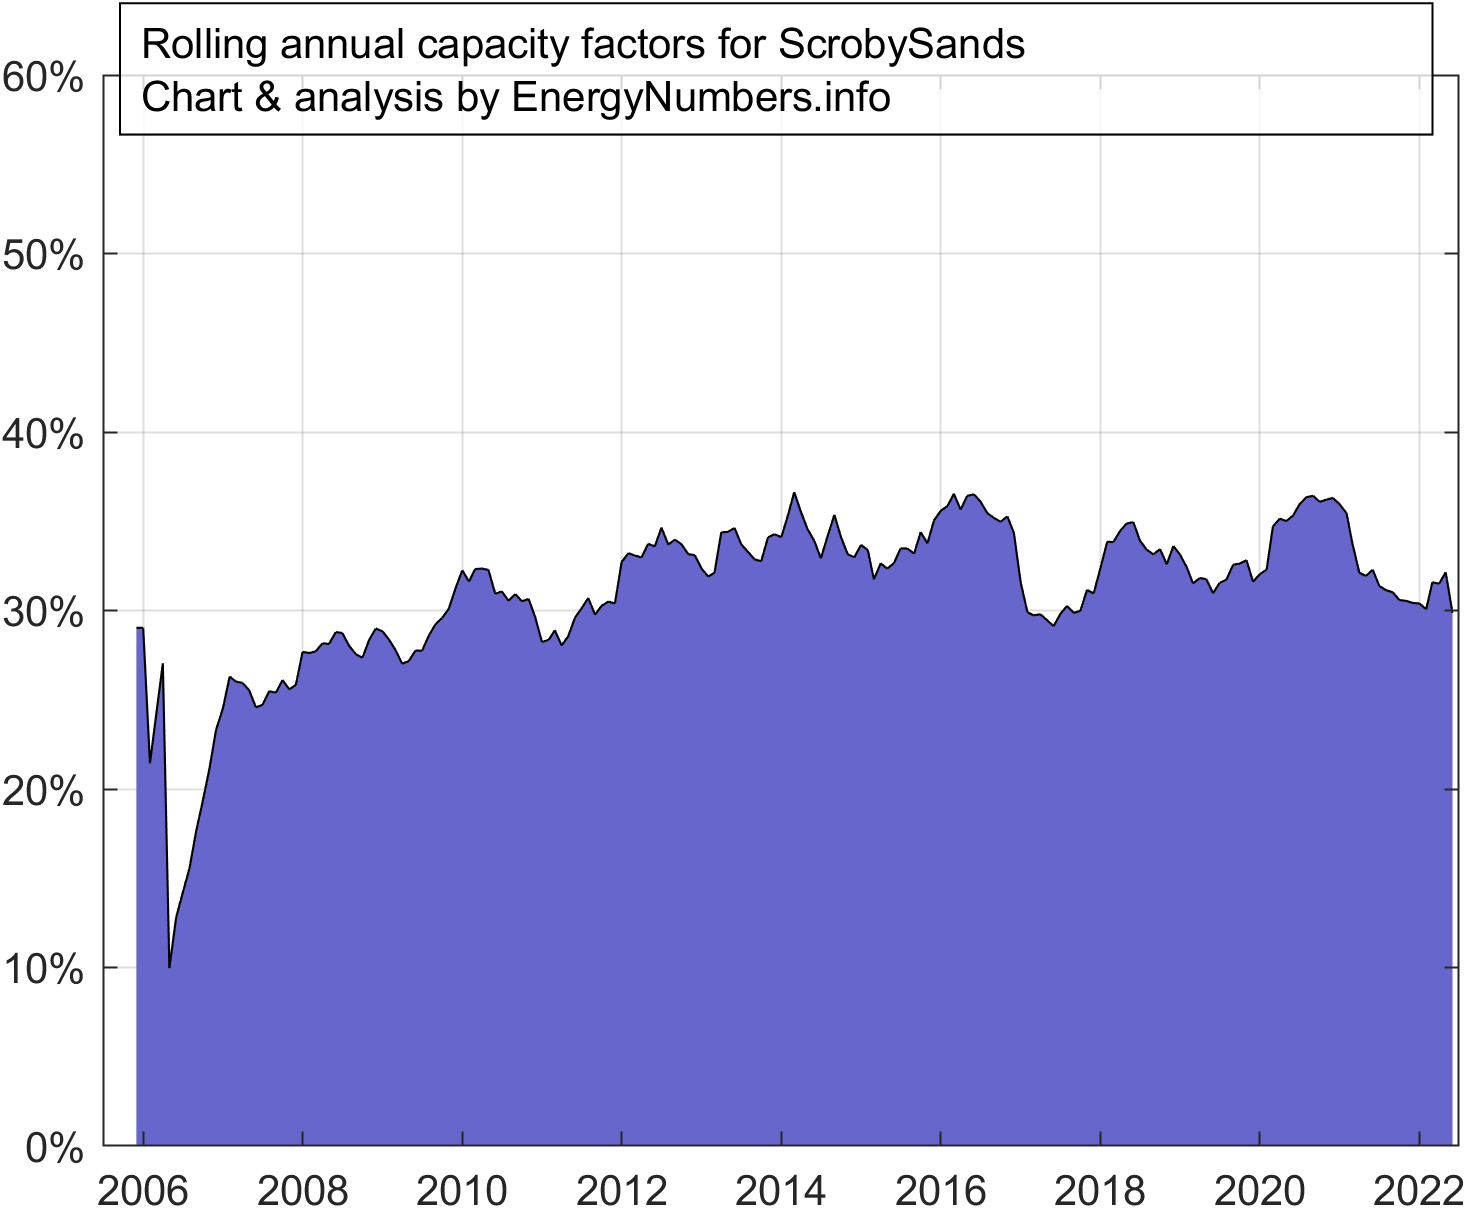 |
|
| Teesside | 35.5% | 11.4 | 62 | 2,175 | 5.1 | 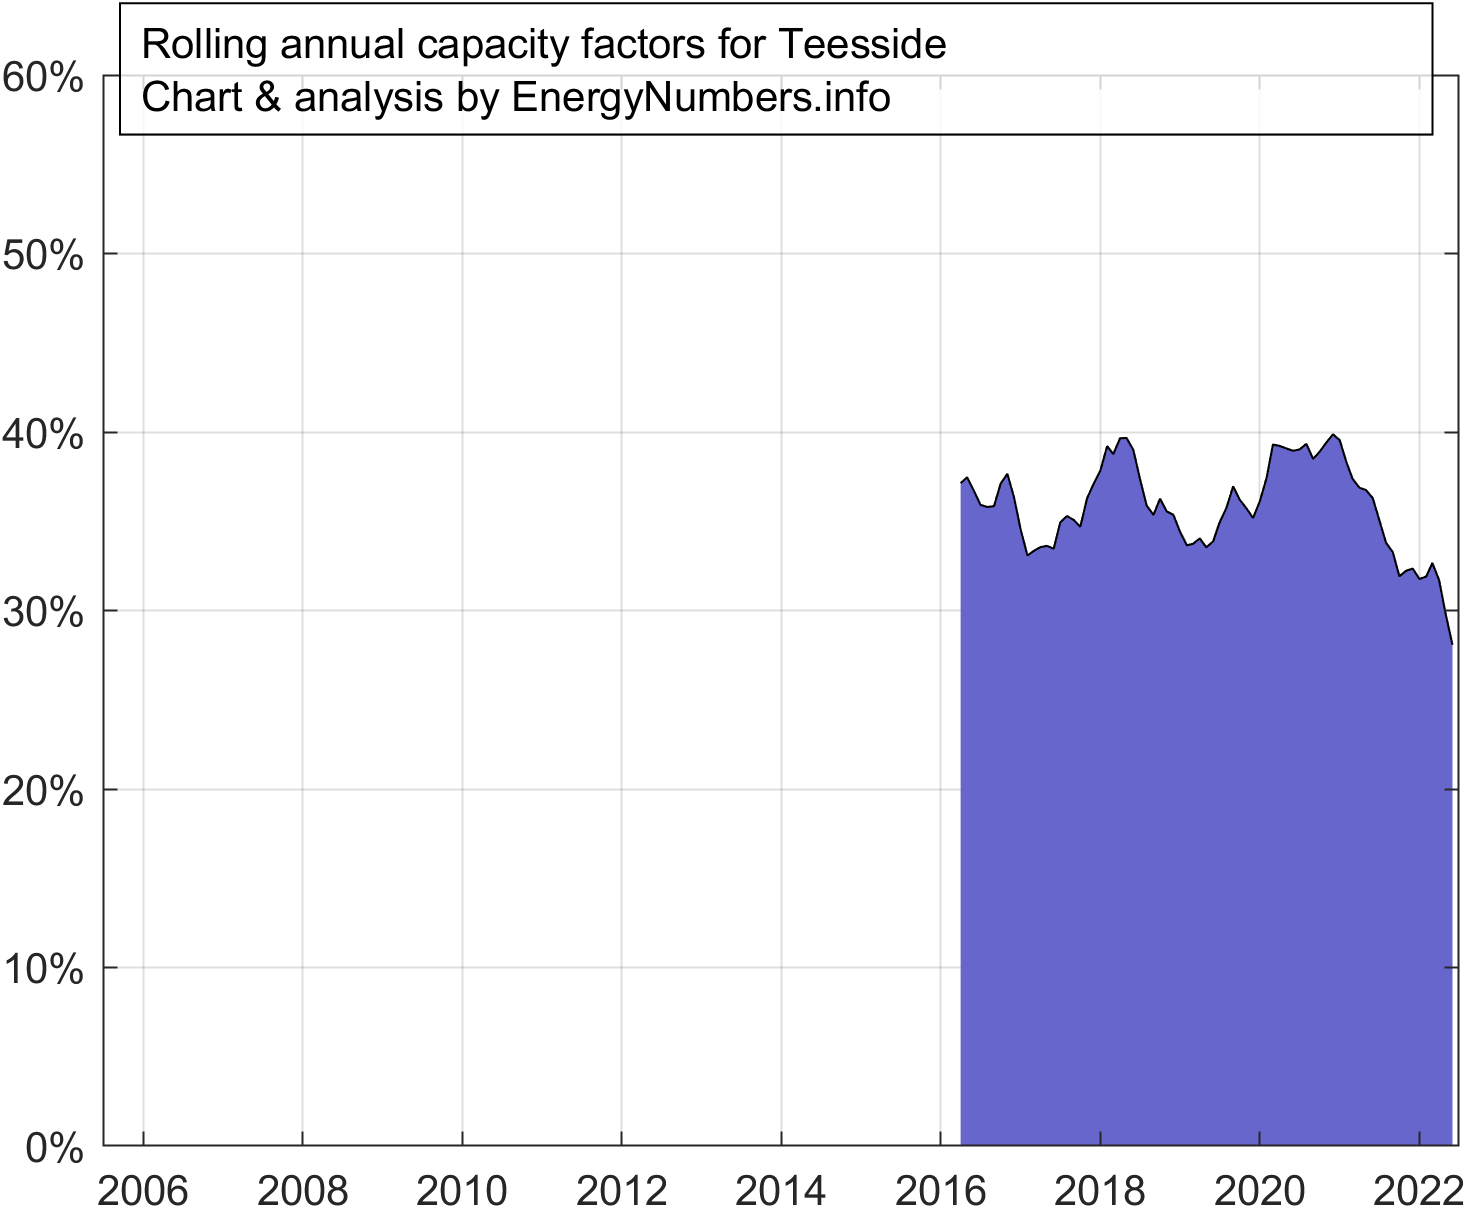 |
|
| Hornsea Two | 48.6% | 42.7% | 4.2 | 1,386 | 21,627 | 1.3 | 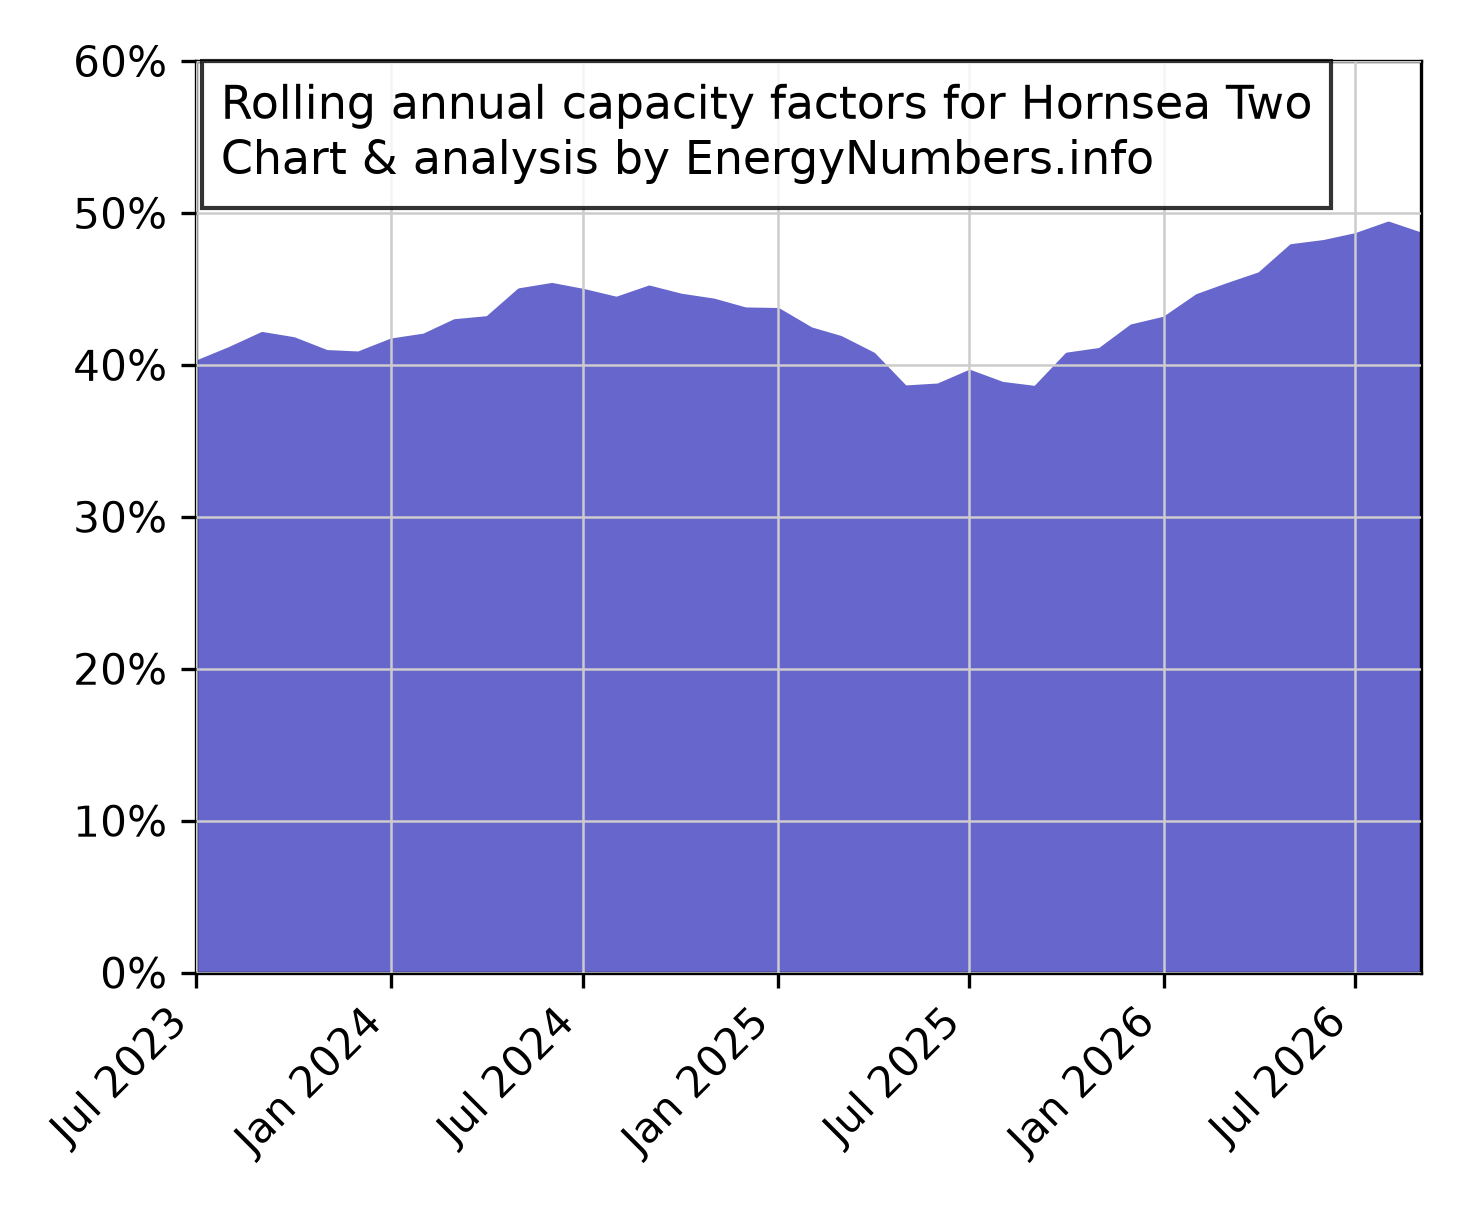 |
| Seagreen | 16.9% | 15.9% | 2.8 | 1,075 | 4,240 | 0.4 | 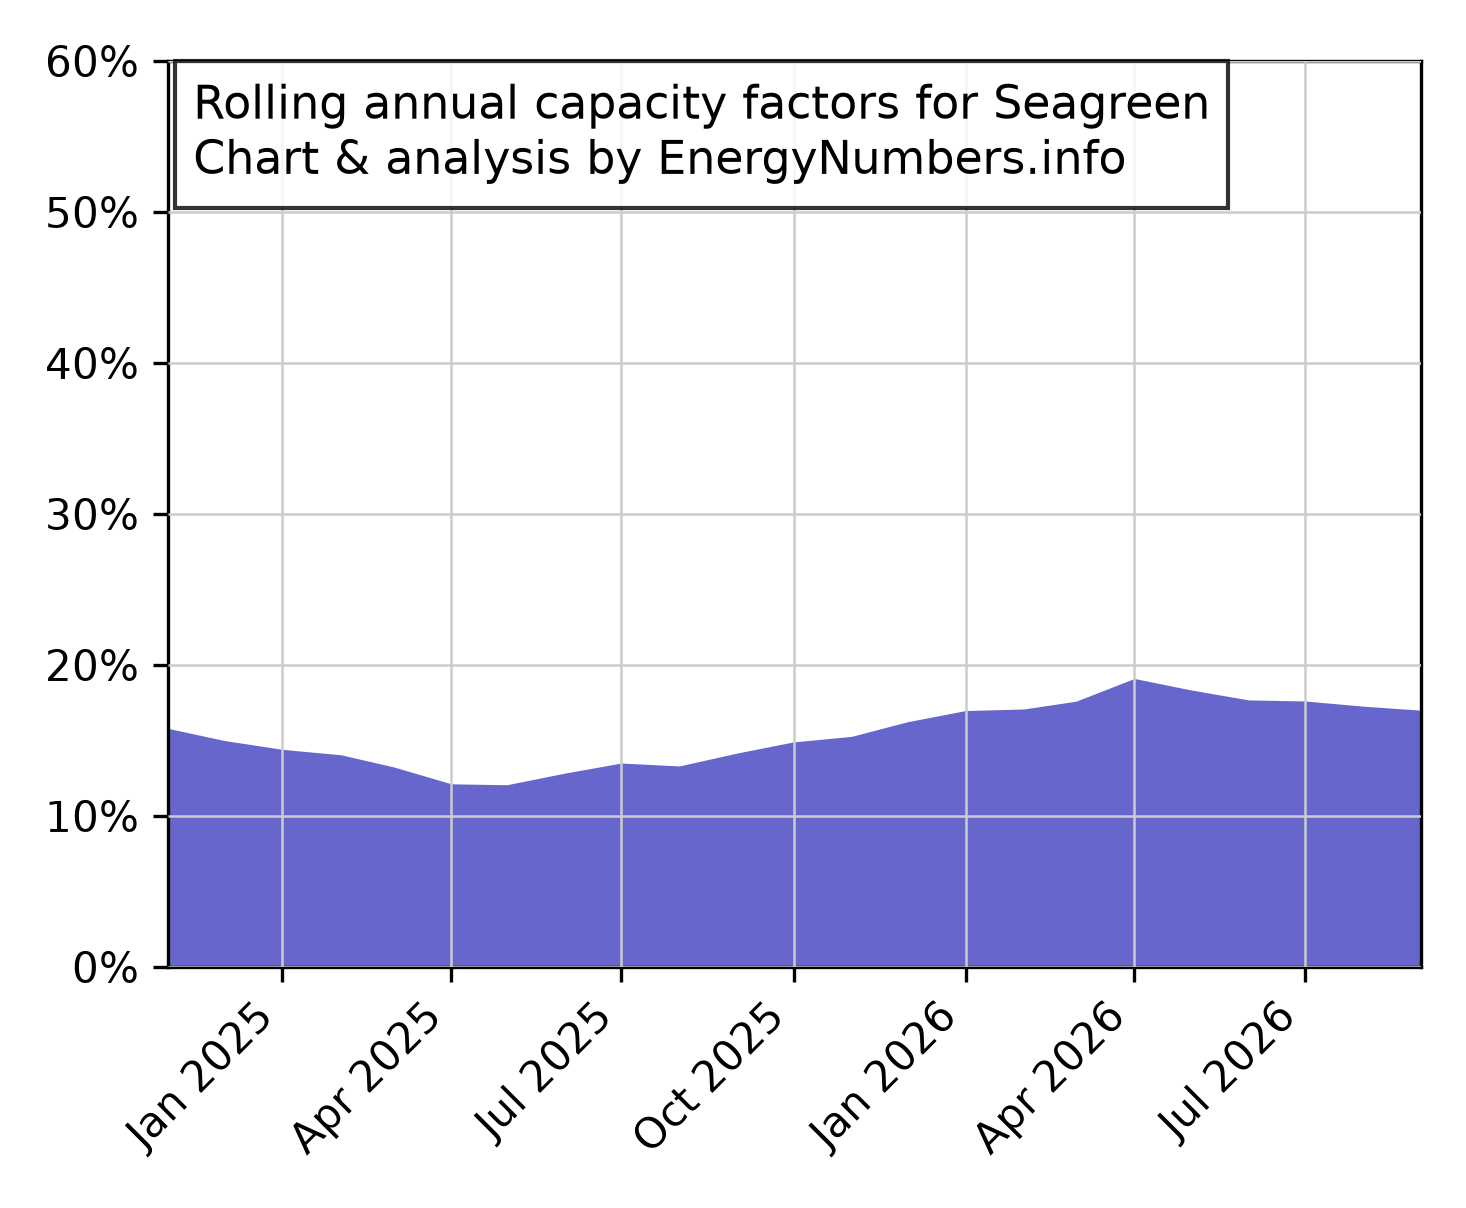 |
| Moray West | 15.8% | 15.1% | 1.5 | 882 | 1,759 | 0.6 | 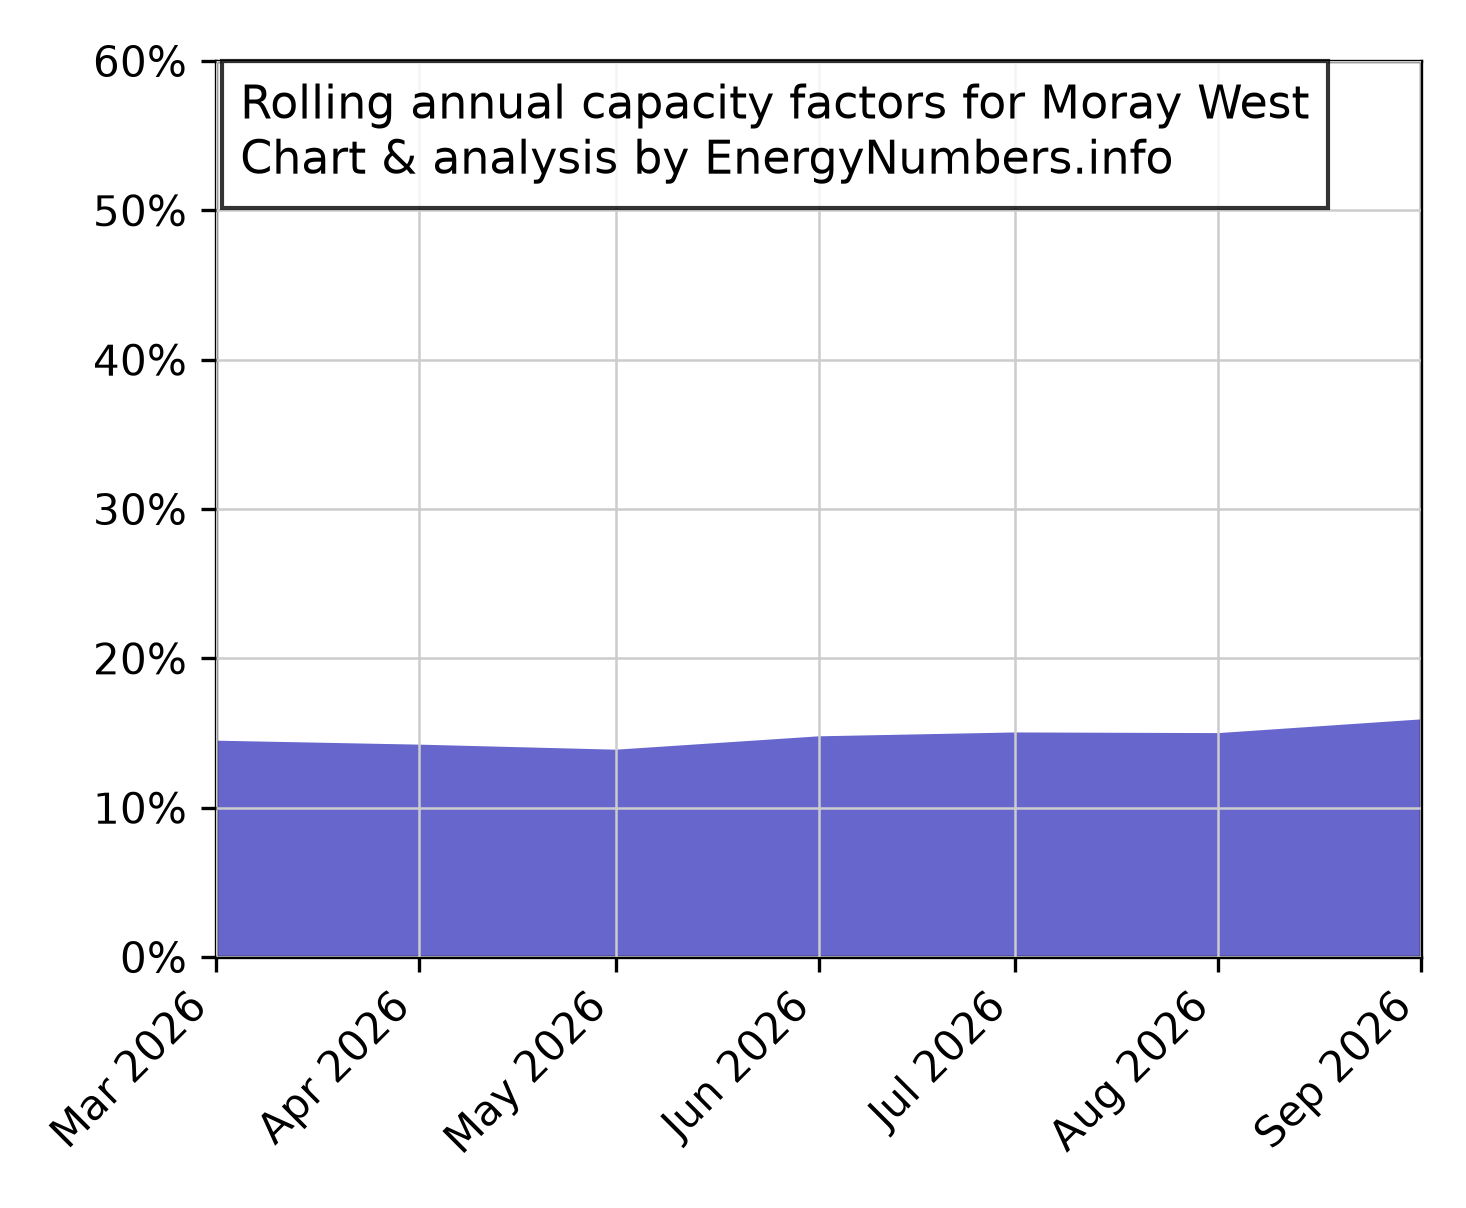 |
| Neart na Gaoithe | 45.7% | 42.6% | 1.4 | 450 | 2,381 | 1.8 | 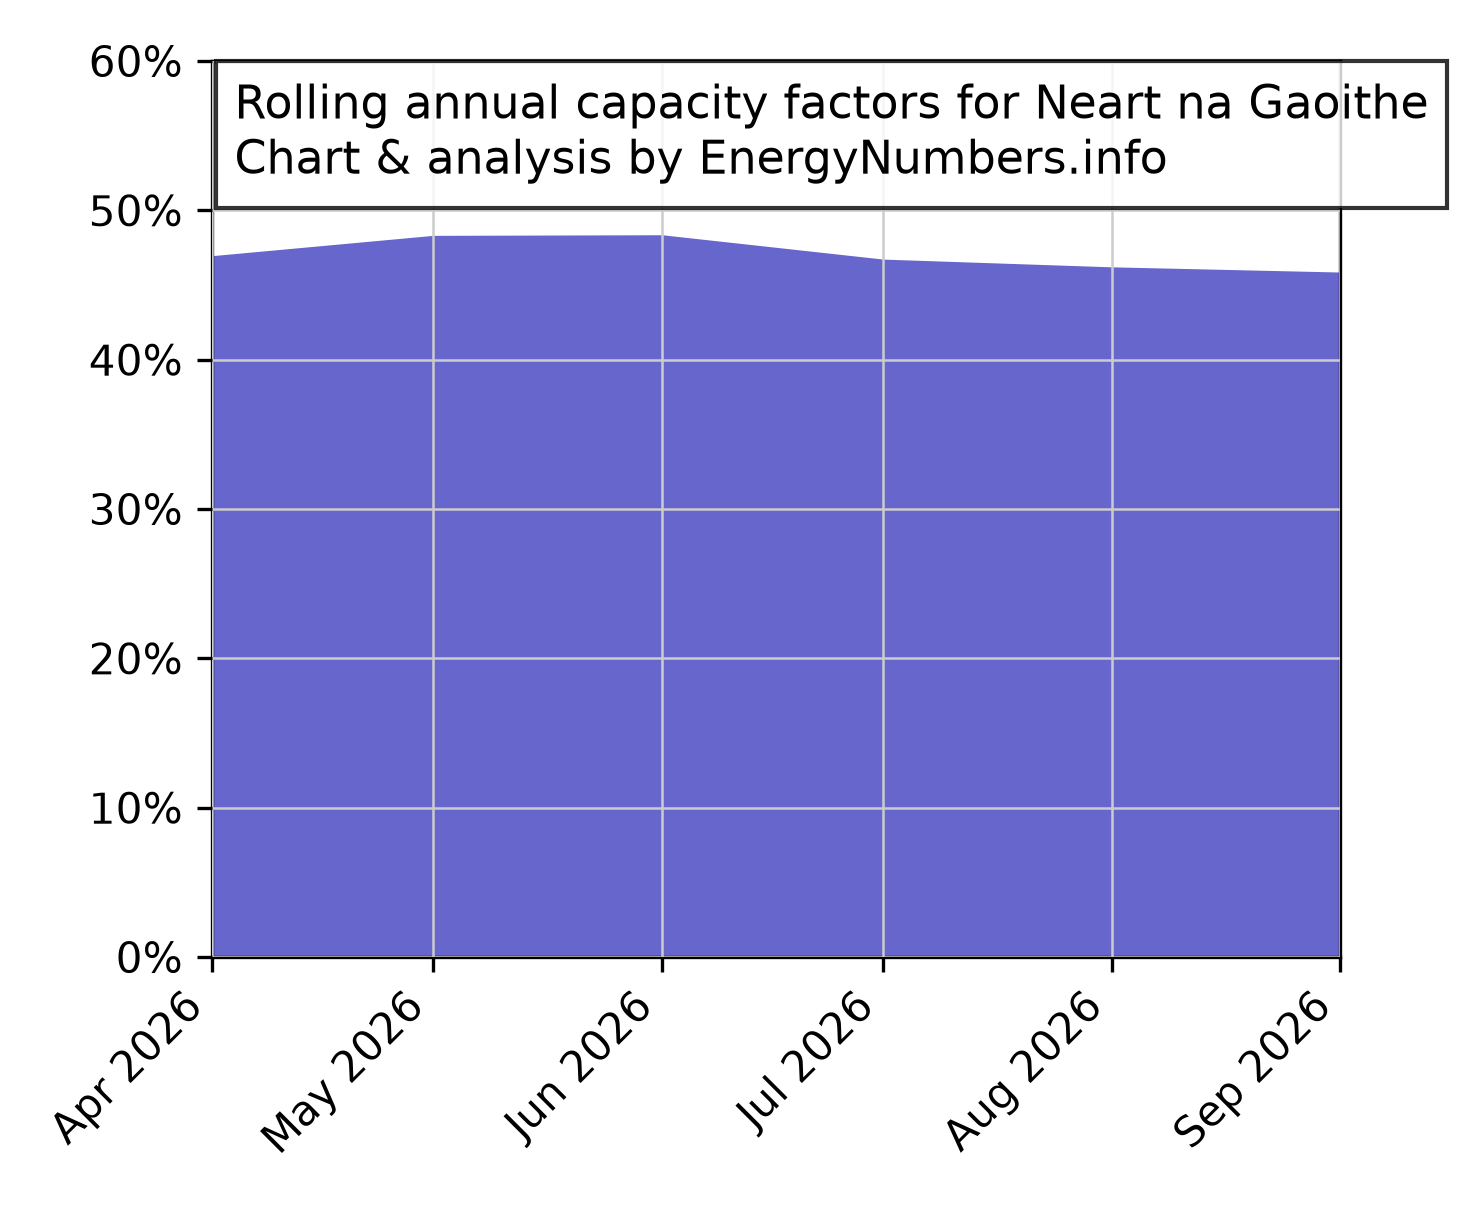 |
| Kincardine | 11.7% | 28.6% | 5.0 | 50 | 626 | 0.6 | 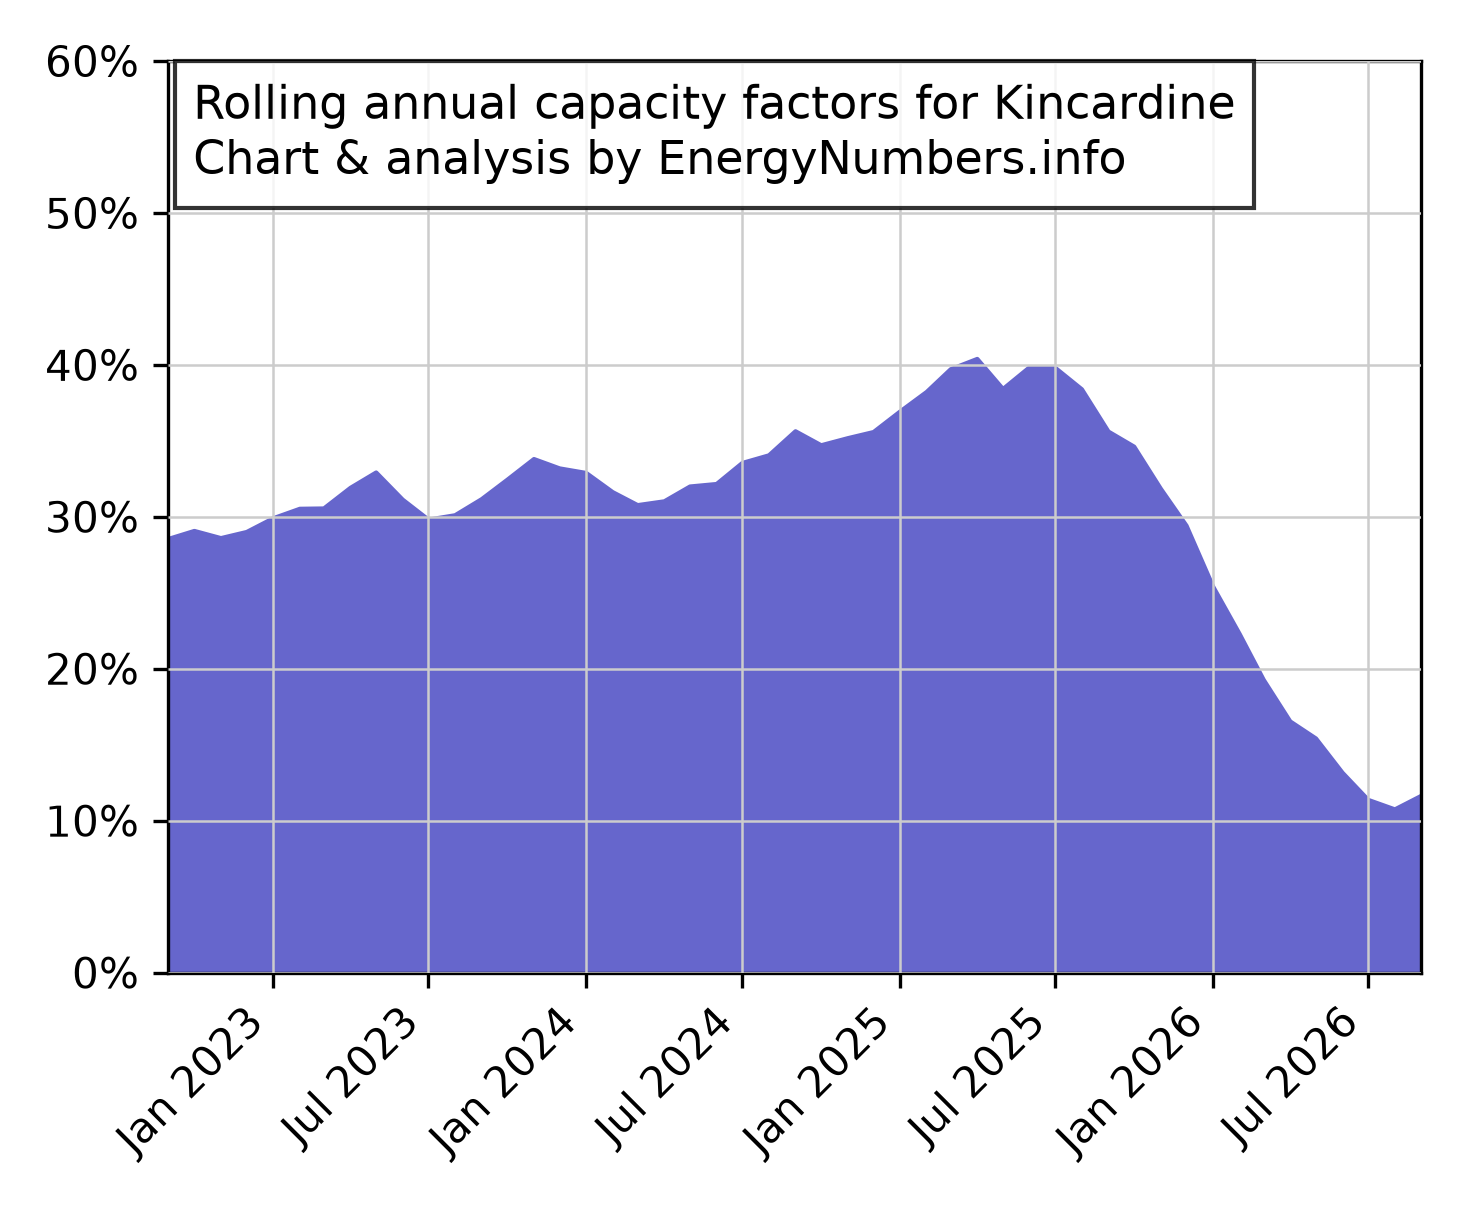 |
Load duration curves
I’ve constructed for each of the offshore windfarms for which there is half-hourly metered data. Use the pause and play buttons to stop and start the sequential display of curves. Click on the windfarm name in the legend to toggle the display of that farm’s curve.
Note that for each individual windfarm, its curve is based on data starting from either January 2009, or from the date that the windfarm was fully commissioned, whichever is more recent. The curve for all windfarms is for the period since 2017.
Capacity factor calculation method
Just as with the Danish offshore windfarm capacity factors, the capacity factors are calculated by calculating, for each wind farm, the number of hours since it was commissioned. This is then multiplied by its capacity, to give the number of peak-MW-hours. This is divided into the total energy generated by that wind farm, to give its capacity factor. The input energy data is from Elexon, and goes back to 2009; and from Ofgem, which goes back to 2000. There are some UK offshore windfarms for which Elexon does not have metered data: for those, I’ve used the REGO data from Ofgem.
Data Licence
Contains BMRS data © Elexon Limited copyright and database right 2026